Average True Range (ATR) Volatility Measure Explained
Average True Range (ATR) measures price movement magnitude over a set period, helping traders set volatility-adjusted stop-losses and size positions correctly.

Overview
Average True Range (ATR) measures price movement magnitude over a set period, helping traders set volatility-adjusted stop-losses and size positions correctly.
The Average True Range (ATR) is a volatility indicator developed by legendary market technician J. Welles Wilder Jr. It measures the degree of price movement in a financial instrument over a specific time period—without indicating direction. The ATR is an essential tool for assessing risk, position sizing, and stop-loss placement in both discretionary and systematic trading strategies.
Core Calculation
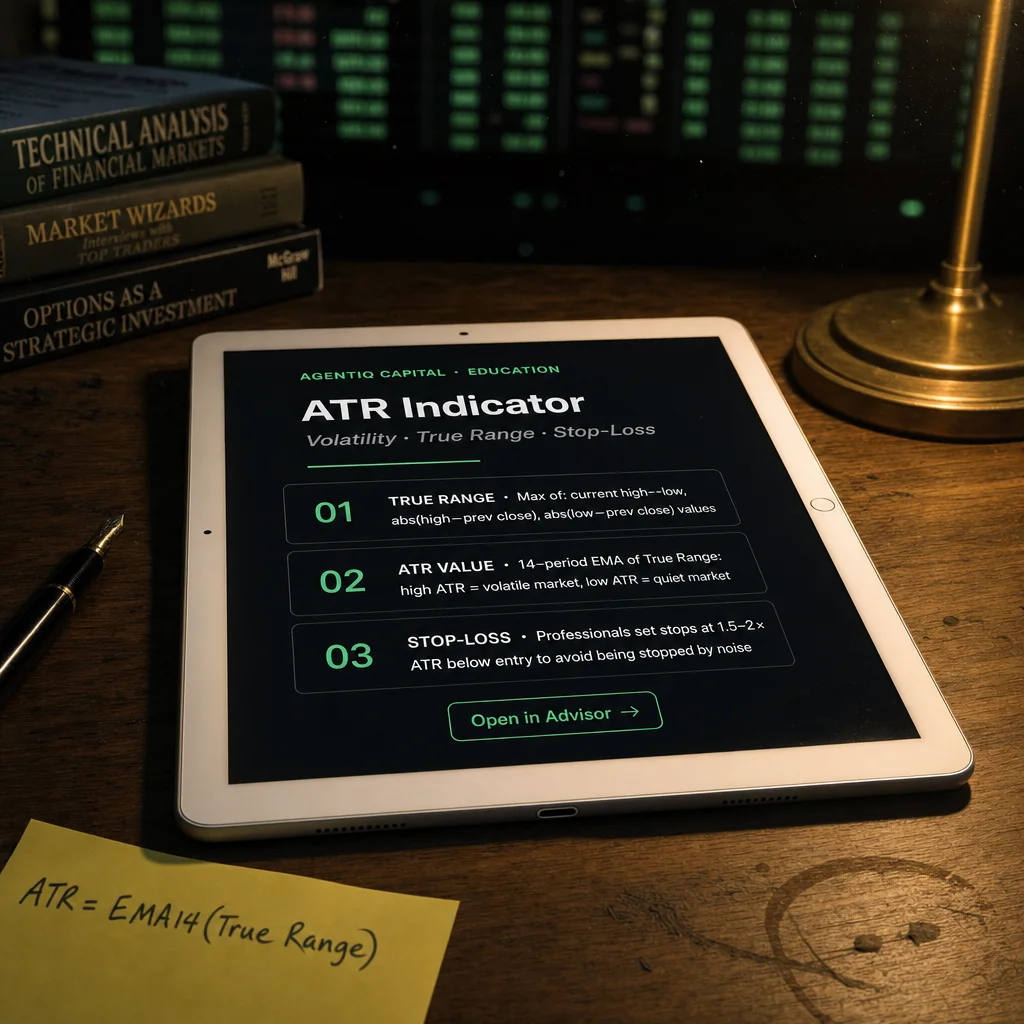
True Range (TR) is the greatest of:
Current high – current low
|Current high – previous close|
|Current low – previous close|
Average True Range is the moving average (typically 14 periods) of the True Range values:
(Formula — visualization pending)
or in modern systems:
(Formula — visualization pending)
- n = 14 periods is common, but it can be adjusted for higher or lower sensitivity.
Interpretation and Use Cases
| ATR Behavior | Interpretation |
|---|---|
| Rising ATR | Increasing volatility; larger price swings, possibly due to breakouts, earnings, macro events |
| Falling ATR | Decreasing volatility; tighter price movement, typically during consolidation or calm trends |
| Low ATR | Often precedes volatility expansions |
| High ATR | Can mark climactic turning points or unstable markets |
Strategic Applications
Risk Management:
- ATR is commonly used to set volatility-adjusted stop-losses:
(Formula — visualization pending)
where k is a multiplier (e.g., 1.5 or 2.0).
Position Sizing:
- Traders use ATR to size positions based on the volatility of the instrument—lower ATR = larger position; higher ATR = smaller position.
Breakout Confirmation:
- ATR spikes often accompany price breakouts from support or resistance zones.
Trailing Stops:
- Dynamic stop levels can be trailed based on a multiple of ATR to lock in profits during volatile trends.
Limitations
Non-directional: ATR shows how much price moves, not which way.
Lagging: As a moving average, ATR is reactive, not predictive.
Context needed: ATR must be interpreted alongside price action, trend indicators, or chart patterns for effective decision-making.
Summary
The Average True Range (ATR) is a cornerstone volatility tool in the professional trader's toolkit. It enables precision in risk management, enhances strategy robustness, and provides a clear signal of market conditions—from breakout opportunities to periods of consolidation. When integrated into a broader framework of technical and fundamental analysis, ATR helps protect capital and optimize trade timing with confidence and clarity.