A core technical analysis tool that smooths out price data to create a single flowing line, making it easier to identify market trends.
Technical analysis tracks the past; it does not predict the future. You have to use your own intelligence to draw conclusions.
The Simple Moving Average (SMA) is one of the most fundamental and widely used technical indicators. By calculating the average price of a security over a specific number of periods, the SMA filters out the ‘noise’ of random short-term price fluctuations. This provides a clearer view of the underlying trend, helping traders make more informed decisions about entries and exits.
Understanding the Simple Moving Average
A Simple Moving Average is a calculation that takes the arithmetic mean of a given set of prices over a specific number of days in the past; for example, over the previous 15, 50, or 200 days. It is called a ‘moving’ average because as new daily prices become available, the oldest data point is dropped, and the average is recalculated, causing the line on a chart to move along with the price.
Traders use SMAs of different lengths for different purposes. A short-term SMA (like a 10-day or 20-day) reacts more quickly to price changes, while a long-term SMA (like a 100-day or 200-day) is much slower and smoother, reflecting the long-term trend.
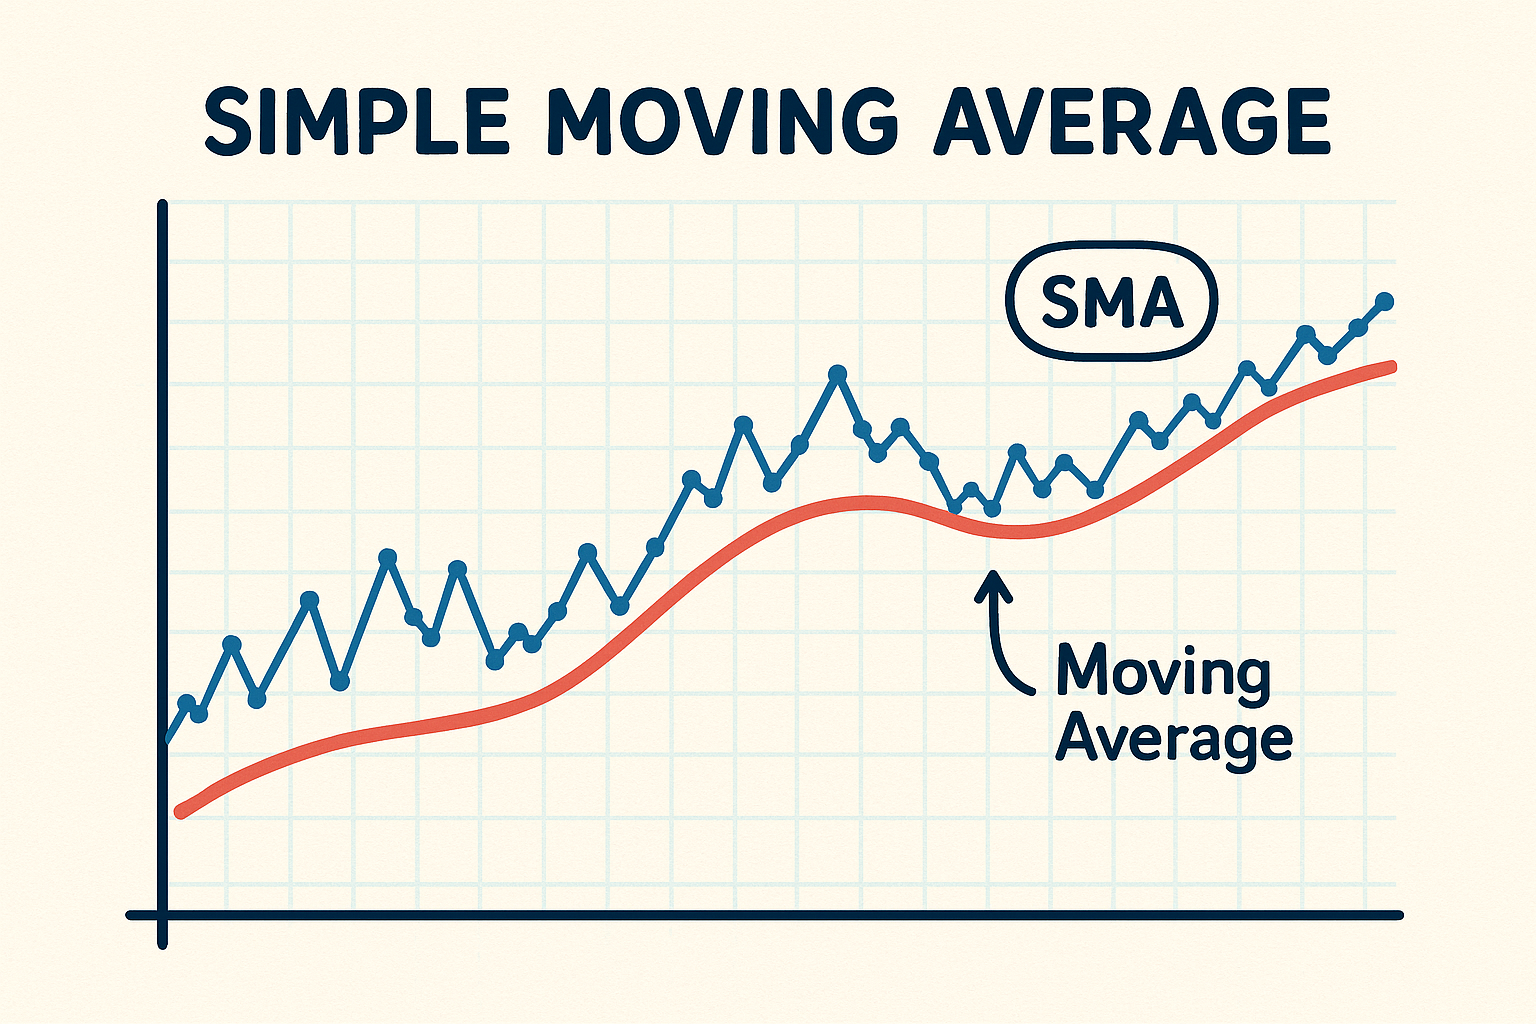 Visual representation of Simple Moving Average
“Technical analysis tracks the past; it does not predict the future. You have to use your own intelligence to draw conclusions.”
— Bruce Kovner, Hedge fund trader, founder of Caxton Associates Market Wizards: Interviews with Top Traders, Jack D. Schwager (New York Institute of Finance, 1989), chapter “Bruce Kovner — The World Trader” (1989)
The Formula and Calculation of the SMA
The formula for the Simple Moving Average is straightforward. You sum up the closing prices for the chosen number of periods and then divide by that same number of periods.
Formula:
Where:
- P = Price (typically the closing price)
- n = The number of periods (e.g., 10 days, 20 minutes, etc.)
Calculation Example: 5-Day SMA
Let’s say a stock has the following closing prices over five days: Day 1: 112, Day 3: 114, Day 5: $115. To find the 5-day SMA at the end of Day 5, you would calculate:
(110 + 112 + 111 + 114 + 115) / 5 = **117, you would drop the Day 1 price and add the new price: (112 + 111 + 114 + 115 + 117) / 5 = $113.80.
How to Use the SMA in Trading
The SMA is a versatile tool that can be used in several ways to analyze the market and generate trading signals.
Core Trading Strategies
- Trend Identification: The primary use of the SMA is to identify the direction of a trend. If the SMA is angled up, the trend is generally considered to be up (bullish). If the SMA is angled down, the trend is down (bearish). A flat or sideways SMA suggests a ranging or trendless market.
- Moving Average Crossovers: A popular strategy involves using two SMAs of different lengths. A ‘Golden Cross’ (bullish signal) occurs when a shorter-term SMA (e.g., 50-day) crosses above a longer-term SMA (e.g., 200-day), suggesting the start of an uptrend. A ‘Death Cross’ (bearish signal) occurs when the shorter-term SMA crosses below the longer-term SMA, indicating a potential downtrend.
- Dynamic Support and Resistance: The SMA line itself can act as a dynamic level of support or resistance. In an uptrend, price will often pull back to the SMA and ‘bounce’ off it, presenting a buying opportunity. In a downtrend, the price may rally up to the SMA and be ‘rejected’ by it, offering a selling opportunity.
The Limitations of the Simple Moving Average
While useful, the SMA is not perfect and has weaknesses that traders must be aware of. Understanding its limitations is crucial for effective use.
SMA is a Lagging Indicator
The biggest drawback of the SMA is that it lags behind the current price. Because it is based on past data, it will always be slow to react to sudden market reversals. A trend may already be well underway before the SMA signals it.
Furthermore, the SMA gives equal weight to all prices in its calculation period. Critics argue that the oldest price data (e.g., the price from 20 days ago in a 20-day SMA) is less relevant than the most recent price. This equal weighting contributes to its lag. Finally, in choppy, sideways markets, the SMA can produce numerous false signals, as the price frequently crosses back and forth over the line, leading to confusion.
SMA vs. Exponential Moving Average (EMA)
A common alternative to the SMA is the Exponential Moving Average (EMA). The key difference lies in their calculation. The EMA places more weight on the most recent prices, making it more responsive to new information and quicker to react to price changes. This can be an advantage for traders who want earlier signals. However, this sensitivity also means the EMA can be more susceptible to short-term price spikes and false signals compared to the smoother, more stable SMA.