Directional Movement Index (DMI)
A comprehensive guide to the Directional Movement Index (DMI), a powerful tool for identifying and trading with the trend.
Overview
A comprehensive guide to the Directional Movement Index (DMI), a powerful tool for identifying and trading with the trend.
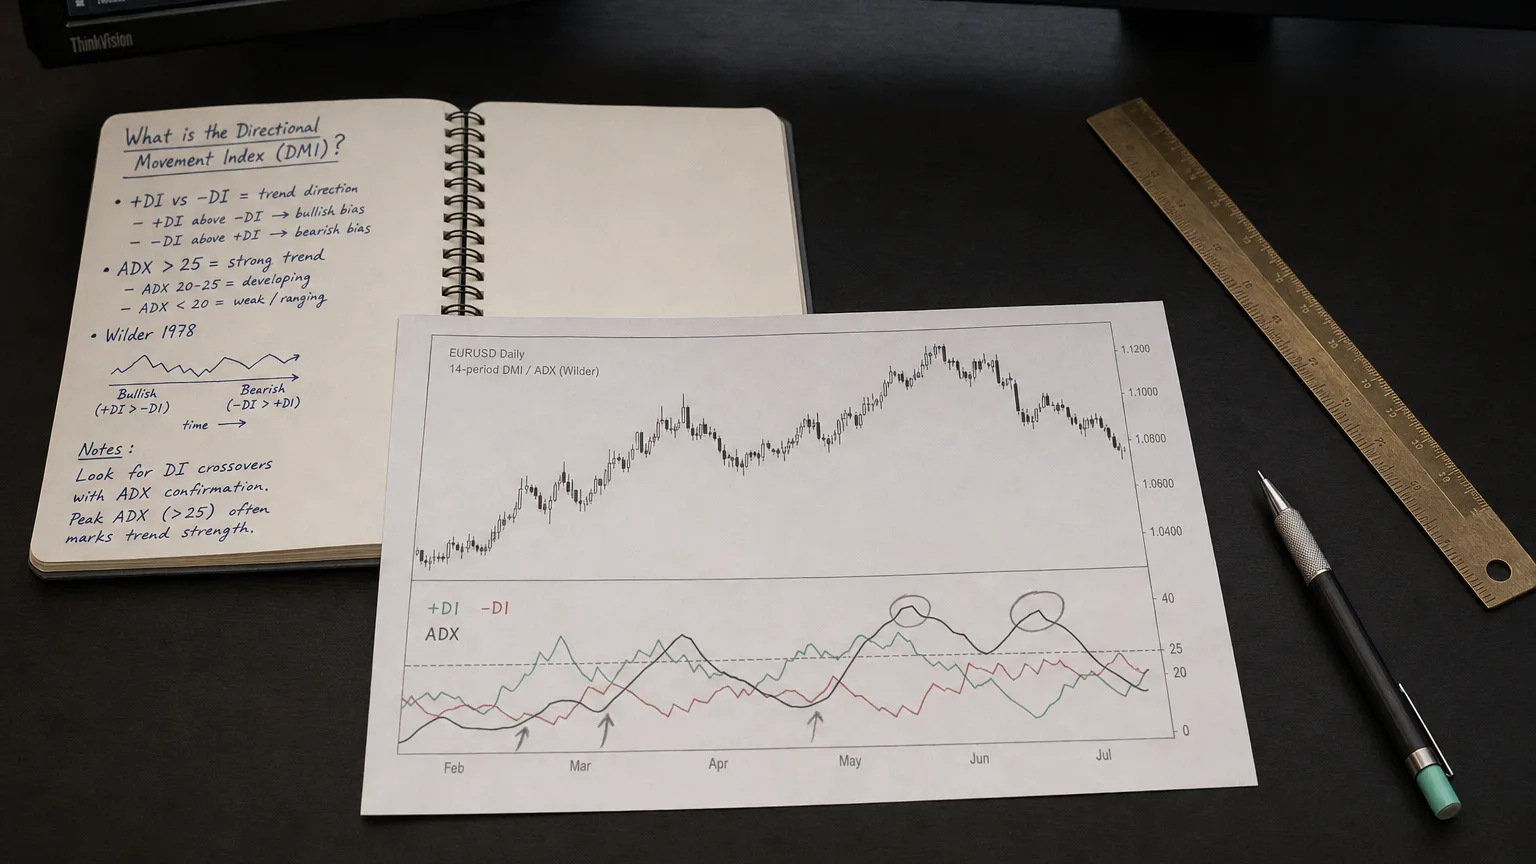
J. Welles Wilder introduced the Directional Movement System in New Concepts in Technical Trading Systems (1978) to solve a dual problem: (i) detect whether price is trending and (ii) gauge how strong that trend is. The system outputs three lines: +DI, –DI (direction) and the Average Directional Index (ADX) (trend strength).
Step-by-step construction
- Directional Movement (DM)
(Formula — visualization pending)
(if both are positive, set the smaller to 0).
- True Range (TR) – the greatest of
(Formula — visualization pending)
- Smooth over n periods (Wilder used n = 14):
(Formula — visualization pending)
where SM is Wilder’s exponential smoothing.
- Directional Index (DX)
(Formula — visualization pending)
- Average Directional Index (ADX) – an n-period average of DX.
(Variant) ADXR = average of the current ADX and the ADX n bars ago, adding extra smoothing.
Interpreting the lines
| Signal | Meaning |
|---|---|
| +DI > –DI | Upside directional bias (buyers dominate). |
| –DI > +DI | Downside bias (sellers dominate). |
| ADX < 20 | Market is likely range-bound / weak trend. |
| ADX 25–40 | Solid trend; strength rises with the value. |
| ADX > 50 | Very strong, often mature trend. |
Direction vs. strength: ADX is non-directional; it climbs whether the prevailing trend is up or down.
Common trading applications
Trend filter – trade only when ADX > 25; go long if +DI > –DI, short if –DI > +DI.
DI crossovers – a fresh cross (+DI rising above –DI with ADX rising) signals a potential long entry; reverse for shorts.
Breakout confirmation – add ADX: a range breakout accompanied by ADX turning up from < 20 often reduces false signals.
Trailing stop – exit a trend trade when ADX turns down from an extreme (e.g., > 40) or when the opposite DI crosses.
Strengths
Quantifies trend strength – avoids binary “trend / no-trend” judgments.
Versatile – works on any asset or timeframe; integrates smoothly with breakout, moving-average or price-action systems.
False-signal filter – ADX filter often halves whipsaws compared with pure crossover rules.
Limitations & pitfalls
Lagging – as with any smoothed indicator, signals arrive after price turns; very short-term traders may find it late.
Flat-market chop – ADX hovers below 20 during prolonged ranges, offering little guidance.
Parameter sensitivity – the classic n = 14 works well for many markets, but faster assets (e.g., crypto) may need shorter look-backs; slower ones (e.g., weekly charts) may need longer.
Implementation checklist
Select a look-back suited to your rhythm (5-10 for scalping, 14 for swing, 21-30 for position).
Define an ADX threshold (25 or 20) to separate trend vs range.
Combine with price structure – e.g., trade only breakouts that coincide with ADX sloping upward.
Size via R – use the ATR or recent swing to place stops; ADX is informational, not a stop tool.
Take-away
The Directional Movement Index trilogy (+DI, –DI, ADX) is Wilder’s classic toolkit for answering two core questions:
Which side is in charge? (compare +DI vs –DI)
How hard are they pressing? (read ADX)
Blend those answers with smart confirmation and risk management, and DMI becomes a robust way to stay with strong trends, avoid dead-zone ranges, and time momentum shifts with greater confidence. Rock on and manage that risk!