Aroon Indicator Trend Direction & Strength Explained
Learn how the Aroon indicator identifies trend direction, strength, and reversals using time-based analysis — with formulas, strategies, and trading signals.

Overview
Learn how the Aroon indicator identifies trend direction, strength, and reversals using time-based analysis — with formulas, strategies, and trading signals.
The Aroon indicator is a versatile technical analysis tool developed by Tushar Chande in 1995. Its name is derived from the Sanskrit language and means 'dawn's early light,' which aptly describes its purpose: to signal the beginning of a new trend. The Aroon indicator is unique in its focus on the time elapsed since a security has reached a new high or low, rather than just the price movement itself. This makes it a powerful tool for identifying trend direction, strength, and potential reversals with a high degree of accuracy.
What is the Aroon Indicator?
The Aroon indicator is a range-bound oscillator that measures the strength and direction of a trend. It consists of two lines: the Aroon Up line, which measures the strength of the uptrend, and the Aroon Down line, which measures the strength of the downtrend. These lines oscillate between 0 and 100, providing a clear visual representation of the market's momentum. Unlike many other momentum oscillators, the Aroon indicator's unique calculation method, which is based on time relative to price, gives it a distinct advantage in identifying new trends as they emerge.
The Aroon indicator is particularly effective at identifying the early stages of a new trend, making it a valuable tool for traders looking to get in on the ground floor of a new market move.

The Components and Calculation of the Aroon Indicator
The Aroon indicator is calculated based on the number of periods that have passed since the price has reached a new high or low within a specified timeframe, typically 25 periods.
The formulas for the Aroon Up and Aroon Down lines are as follows:
- Aroon Up: This line measures the number of periods since the last 25-period high.
- Aroon Down: This line measures the number of periods since the last 25-period low.
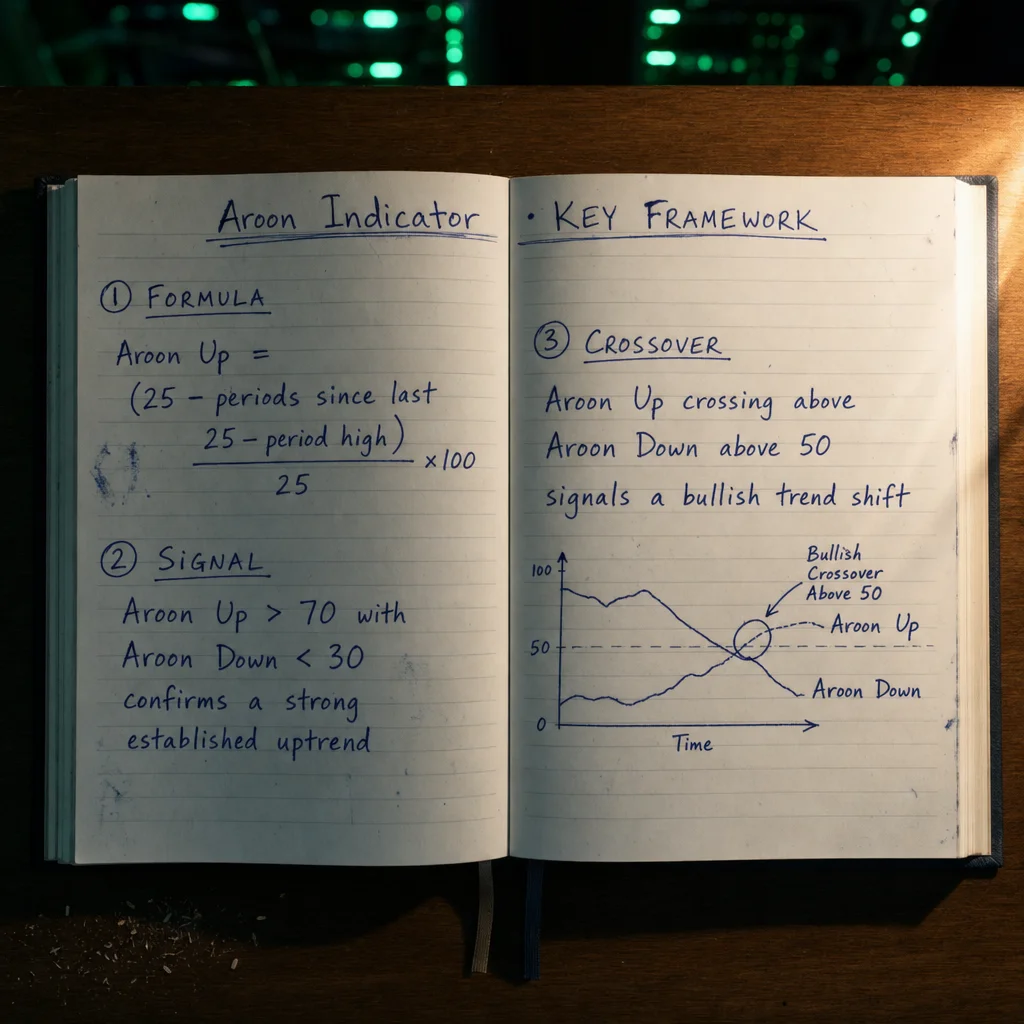
Formula — Aroon Up:
Formula — Aroon Down:
How to Interpret and Use the Aroon Indicator
The interaction between the Aroon Up and Aroon Down lines, as well as their absolute values, provides valuable insights into market behavior:
- Trend Direction: The direction of the trend is indicated by which of the Aroon lines is on top. If the Aroon Up line is above the Aroon Down line, it suggests a bullish trend. Conversely, if the Aroon Down line is above the Aroon Up line, it indicates a bearish trend.
- Trend Strength: The strength of the trend is indicated by the absolute values of the Aroon lines. An Aroon Up line above 70 suggests a strong uptrend, while an Aroon Down line above 70 indicates a strong downtrend. Values below 30 for either line suggest a weakening trend.
- Crossovers: A crossover of the Aroon Up line above the Aroon Down line can be a buy signal, while a crossover of the Aroon Down line above the Aroon Up line can be a sell signal.
- Consolidation: When both the Aroon Up and Aroon Down lines are below 50, it suggests that the market is in a period of consolidation or is range-bound.
Parallel movement of the Aroon Up and Aroon Down lines can also be a sign of a consolidating market.
Signal Reference Table
The following table summarizes the primary signal conditions and their interpretations, as defined in the original Aroon specification:
| Condition | Interpretation |
|---|---|
| Aroon Up near 100 | Strong uptrend |
| Aroon Down near 100 | Strong downtrend |
| Aroon Up crosses above Aroon Down | Bullish crossover (potential buy) |
| Aroon Down crosses above Aroon Up | Bearish crossover (potential sell) |
| Both near 50 or moving sideways | No clear trend (sideways market) |
Use Cases for the Aroon Indicator
The Aroon indicator serves four primary analytical purposes across different market conditions:
Trend Detection: Identifies whether a market is trending or consolidating, giving traders a clear framework before entering a position.
Reversal Signals: Crossovers between Aroon Up and Down may indicate a trend reversal, often earlier than price-based indicators.
Trend Strength Assessment: Values close to 100 imply stronger, more recent highs or lows — allowing traders to gauge how dominant the current trend is.
Early Signal Generation: Because it is based on time rather than price magnitude, the Aroon can alert traders to potential shifts earlier than some traditional momentum indicators.
Trading Strategies with the Aroon Indicator
Crossover Strategy
A common strategy is to enter a long position when the Aroon Up line crosses above the Aroon Down line, and the Aroon Up line is above 50. Conversely, a trader might enter a short position when the Aroon Down line crosses above the Aroon Up line, and the Aroon Down line is above 50. Stop-losses can be placed at recent swing highs or lows.
Trend Strength Strategy
The Aroon indicator can be used to confirm the strength of a trend before entering a trade. For example, if a trader identifies a potential uptrend using another method, they can look to the Aroon indicator for confirmation. If the Aroon Up line is above 70 and the Aroon Down line is below 30, it confirms a strong uptrend and provides a high-probability entry signal.
The Aroon Oscillator: A Combined View
The Aroon Oscillator is a single line that is derived from the Aroon indicator by subtracting the Aroon Down line from the Aroon Up line. The oscillator fluctuates between -100 and +100.
The Aroon Oscillator provides a simplified view of the market:
- Positive values suggest a bullish trend.
- Negative values indicate a bearish trend.
- A move above the zero line can be a buy signal, while a move below the zero line can be a sell signal.
- Extreme readings (above 50 or below -50) indicate a strong trend.
Formula:
The Importance of the Aroon Indicator in Technical Analysis
The Aroon indicator is a valuable addition to any trader's toolkit because of its unique focus on time. By measuring how long it has been since a new high or low, the Aroon indicator can provide a leading signal of a potential trend change. This is in contrast to many other trend-following indicators, which are lagging by nature. The Aroon indicator's ability to identify trend direction, strength, and consolidation phases makes it a comprehensive and versatile tool for a wide range of trading styles.
Limitations of the Aroon Indicator
While the Aroon indicator is a powerful tool, it is not without its limitations:
- Whipsaws in Choppy Markets: Like many oscillators, the Aroon indicator can produce frequent false signals (whipsaws) in sideways or choppy markets.
- Lagging in Certain Conditions: While it can provide leading signals for new trends, it can lag in signaling the end of a trend, particularly a strong one.
- Can Be Overly Sensitive: The crossover signals can sometimes be too frequent, leading to overtrading if not used with other confirmation tools.
To improve the reliability of the Aroon indicator, it is recommended to use it in conjunction with other technical analysis tools, such as moving averages, support and resistance levels, and volume analysis.
"There is nothing new on Wall Street or in stock speculation. What has happened in the past will happen again and again."
— Jesse Livermore, Legendary Stock Trader Reminiscences of a Stock Operator (1923)