The Aroon Oscillator subtracts Aroon Down from Aroon Up over a set period (default 25). Values above +50 signal a fresh bullish trend; below −50 a bearish one. Zero-line crossovers mark momentum shifts. Created by Tushar Chande in 1995.
The hard-to-accept great paradox in the stock market is that what seems too high and risky to the majority usually goes higher and what seems low and cheap usually goes lower.
Created by Tushar Chande in 1995, the Aroon Oscillator distills the Aroon Indicator duo into one powerful line oscillating between +100 and –100. It measures how recently price hit new highs versus new lows, revealing not just trend direction but how ‘fresh’ and dominant the move is. Strong positive readings scream recent highs (bulls in charge), deep negatives shout recent lows (bears ruling). It’s the clever time-based way to catch emerging trends early, filter chop, and spot potential reversals – a favorite for traders who want momentum insight without the usual price-magnitude bias.
The Core Formula – Time Over Price
Built from the Aroon pair:
- Aroon Up = 100 × (Period − Periods since period high) / Period
- Aroon Down = 100 × (Period − Periods since period low) / Period
- Aroon Oscillator = Aroon Up − Aroon Down
Result: +100 if new high today, –100 if new low today. Zero when highs and lows equally aged.
Common period 25; shorter (14) for faster signals, longer (50) for smoother trends.
“The hard-to-accept great paradox in the stock market is that what seems too high and risky to the majority usually goes higher and what seems low and cheap usually goes lower.”
— William J. O’Neil, Founder of Investor’s Business Daily, creator of CAN SLIM investing system How to Make Money in Stocks: A Winning System in Good Times or Bad (1995)
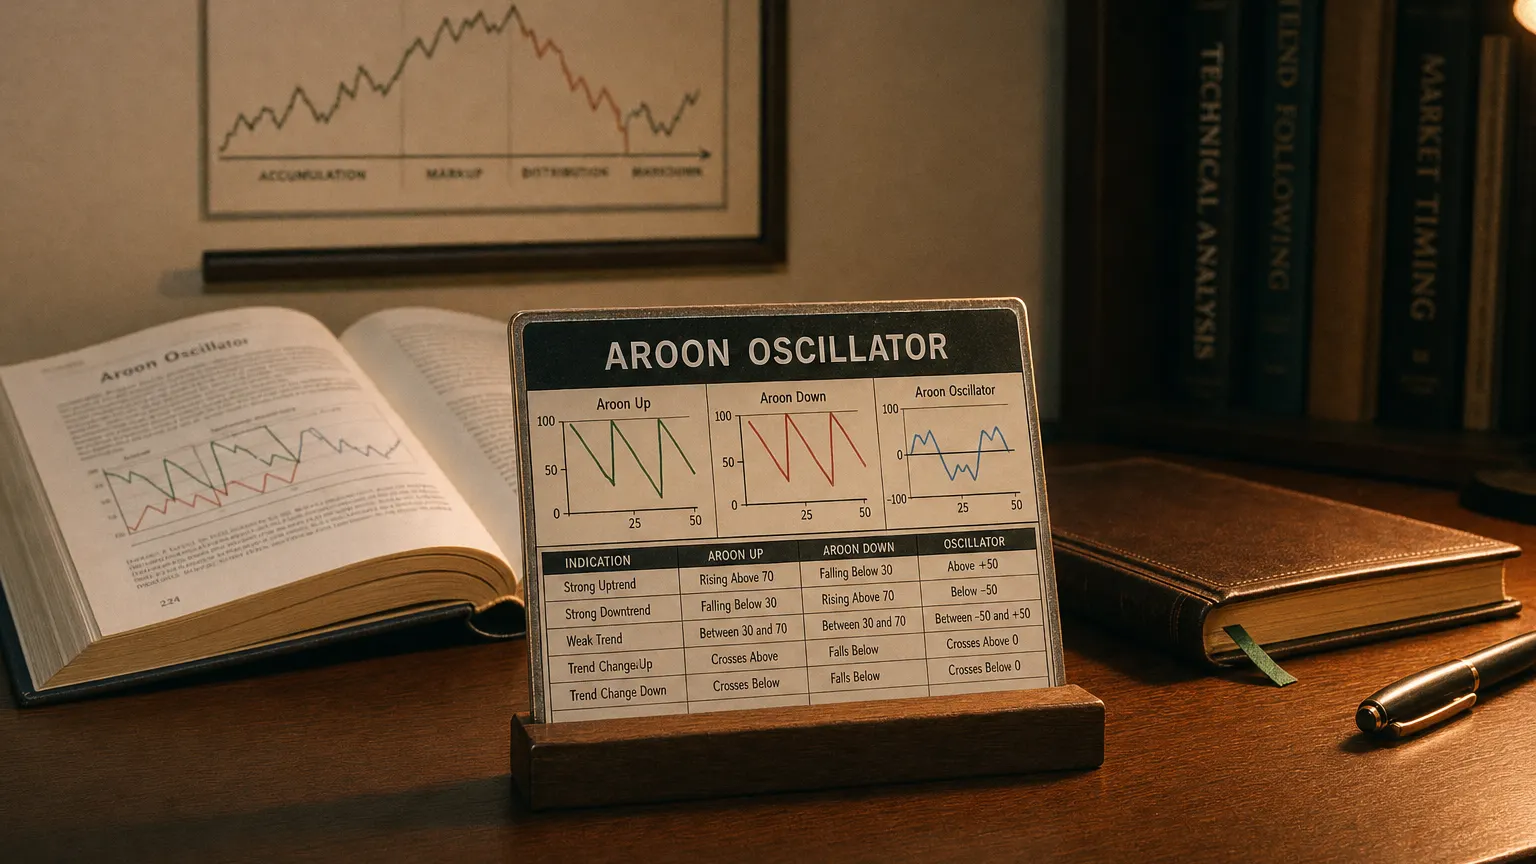
Interpreting the Oscillator
Clear zones:
- +50 to +100: Strong bullish trend – recent highs dominating.
- –50 to –100: Strong bearish trend – fresh lows ruling.
- Around zero: No clear winner – consolidation or transition.
- Crossing above zero: Upside momentum building – potential long setup.
- Crossing below zero: Downside gaining – watch for shorts or exits.
Extremes show trend freshness; sustained high values = powerful move.
Strategic Use Cases
Pro applications:
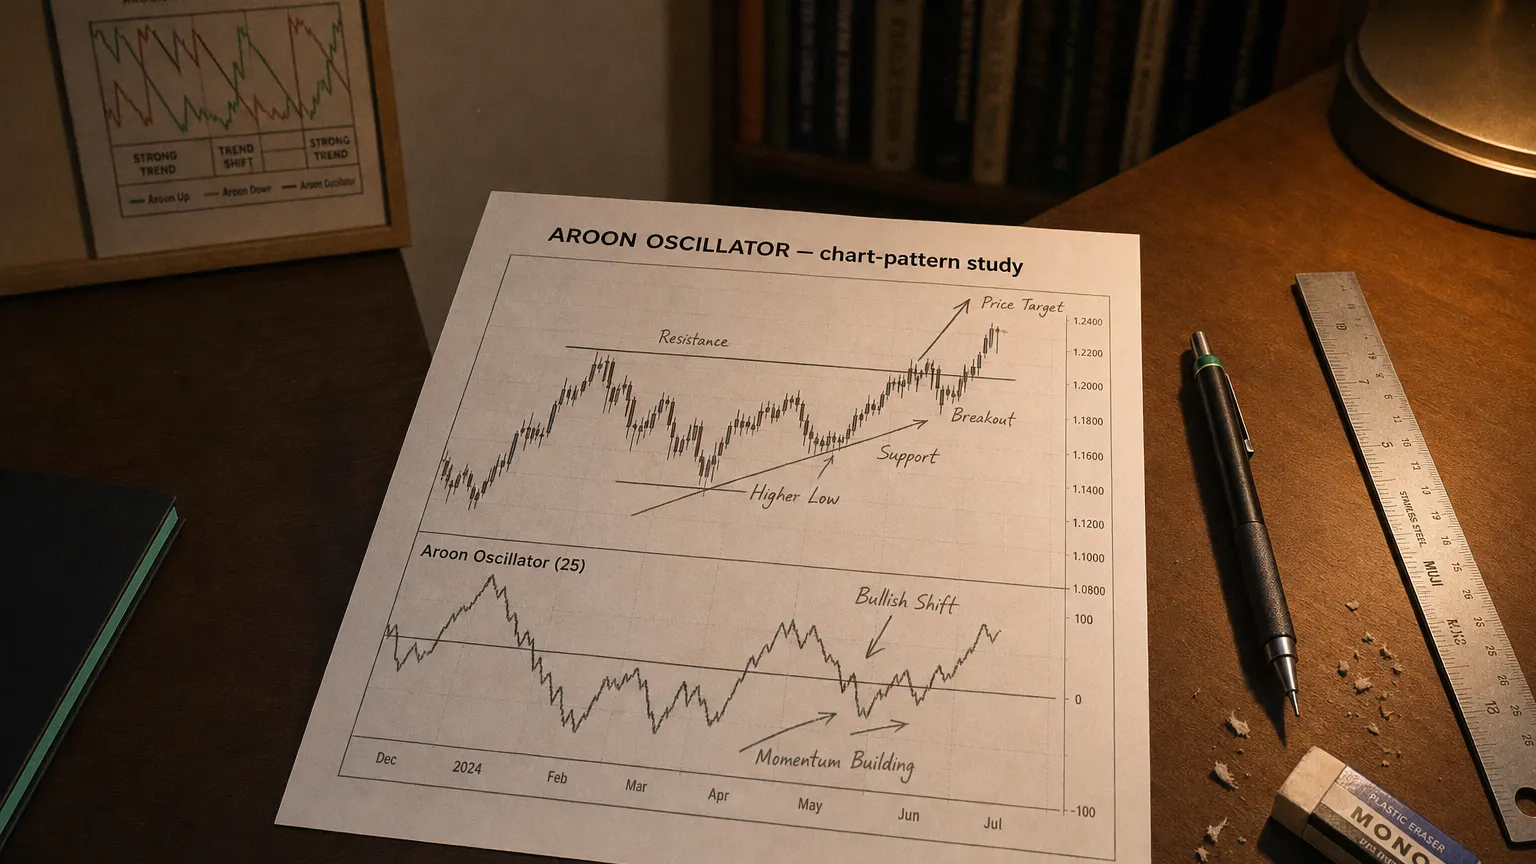
- Early trend detection: Oscillator surging toward +100 → new uptrend starting.
- Trend confirmation: Sustained >+50 in uptrend → stay long confidently.
- Reversal alerts: Cross through zero + price action → potential shift.
- False breakout filter: Breakout without oscillator confirmation → lower probability.
Time-based nature ignores price size – great complement to volume or volatility tools.
Parameter Tweaks
Period choices:
- Short (10–14): Fast – intraday and quick swings, more noise.
- Classic (25): Chande’s standard – balanced daily momentum.
- Long (40–50): Smooth – position trading and macro trends.
Smart Combinations
Pair for power:
- ADX: Aroon Oscillator direction + ADX >25 strength = high-conviction trend.
- MACD/RSI: Momentum cross confirmation.
- Volume: Oscillator extreme + volume spike = real move.
- Price action: Zero cross at S/R = stronger signal.
Strengths and Caveats
The Wins
- Early detection of fresh trends via time-since-extreme logic.
- Clear bounded scale with intuitive zero line.
- Excellent trend confirmation and reversal alerts.
- Works across assets and timeframes.
The Gotchas
- Ignores price magnitude and volatility – false signals in chop.
- Lags slightly in very strong parabolic moves.
- Best with confirmation – not standalone in ranges.
Your Aroon Oscillator Checklist
- Start with classic 25-period.
- Plot zero line and ±50 bands.
- Require trend/volume confirmation on crosses.
- Watch for early surges toward extremes.
- Backtest zero-cross and extreme performance.
- Adjust period for timeframe and volatility.
Q · 01How does the Aroon Oscillator differ from ADX?+
Q · 02What does a zero-line crossover signal on the Aroon Oscillator?+
Q · 03Which Aroon Oscillator period suits day traders versus swing traders?+