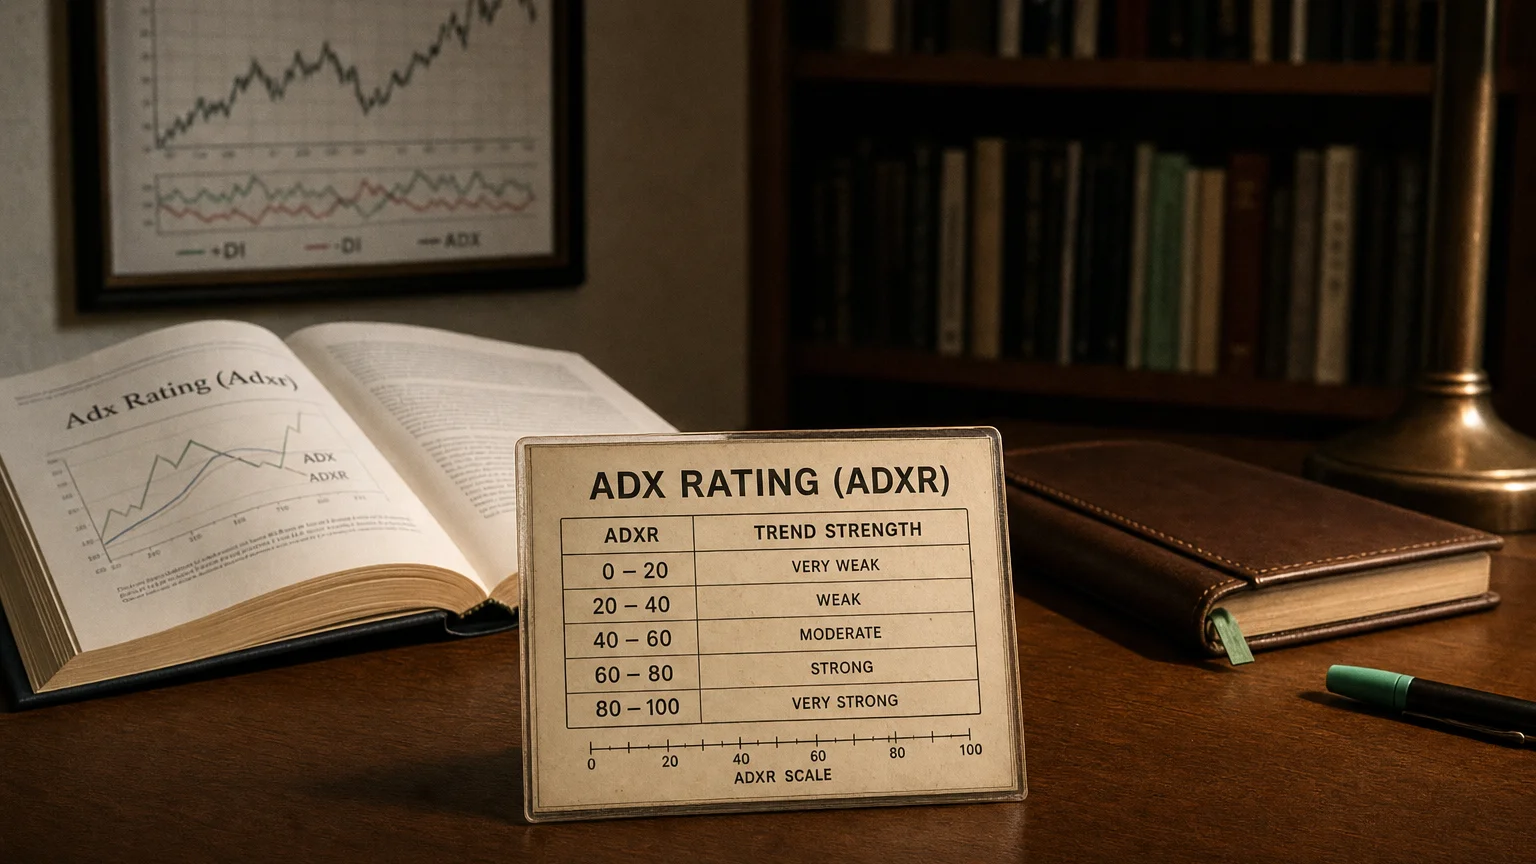
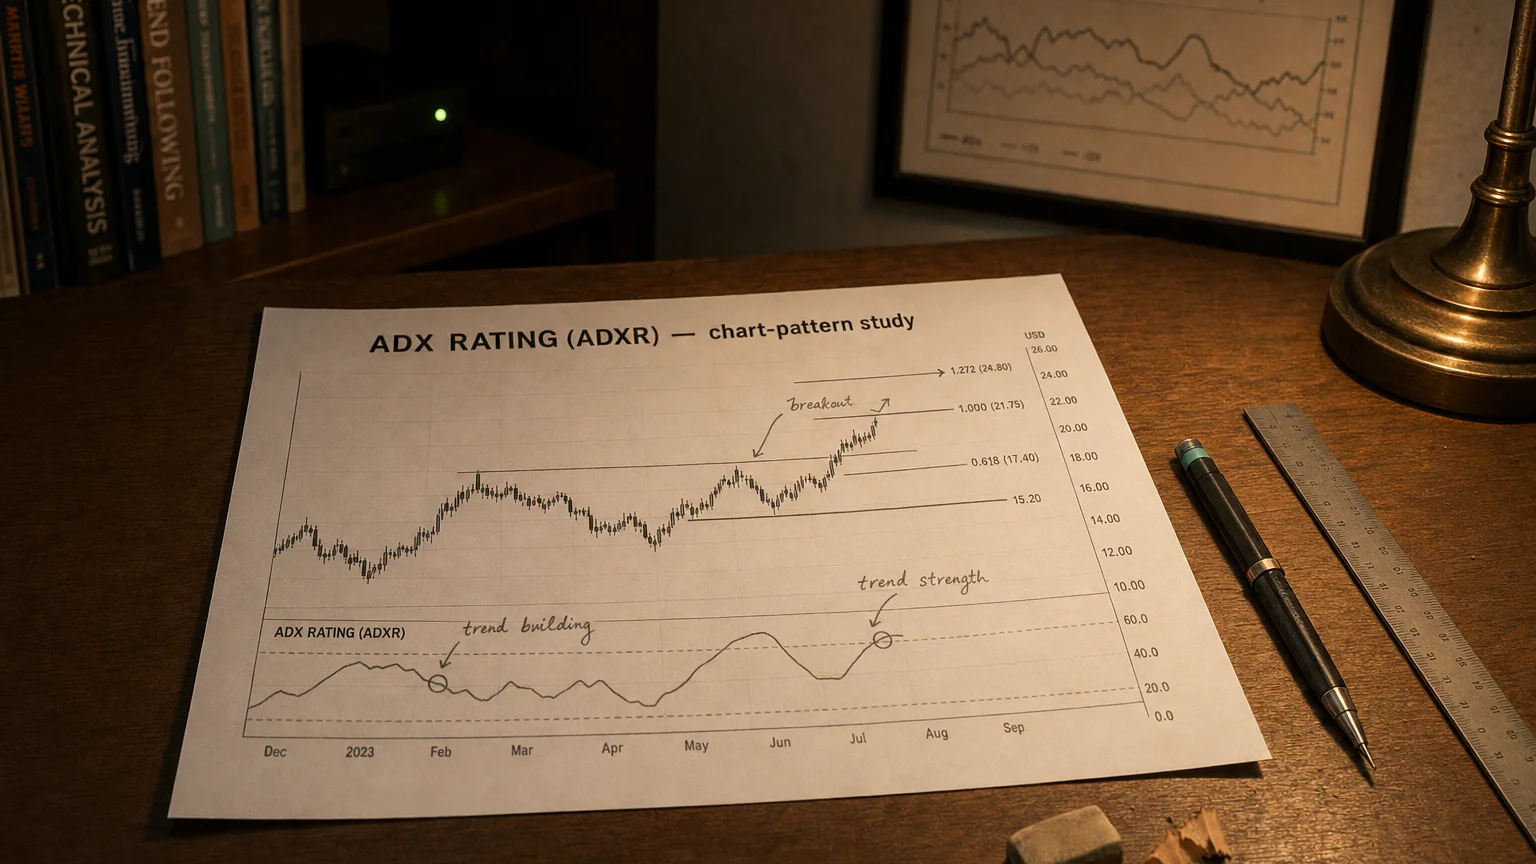
ADX Rating (ADXR) is a smoothed version of the Average Directional Index that averages the current ADX reading with its value from n periods ago—typically 14 periods—and maps the result to labeled strength tiers: weak, moderate, strong, and extremely strong.
There is nothing new on Wall Street or in stock speculation. What has happened in the past will happen again and again.

The Average Directional Movement Index Rating (ADX Rating) is a modified interpretation of the traditional Average Directional Movement Index (ADX). It enhances the ADX to simplify the decision-making process for traders, offering a more intuitive trend strength gauge. Rather than presenting raw ADX values, the ADX Rating classifies the trend strength into easy-to-understand levels.
Calculation
The ADXR is the average of the current ADX and the ADX from a previous period (commonly 14 periods ago):
(Formula — visualization pending)
Where:
-
ADX is the Average Directional Index
-
n is typically 14 (same as the ADX lookback period)
Purpose of ADX Rating
The primary goal of the ADX Rating is to provide a clearer indication of trend strength and to help traders make more confident decisions. It categorizes trends into clearly defined strength levels, making it easier for traders to decide whether to trade a trending market or to avoid it due to insufficient trend strength.
How ADX Rating Works
While the ADX itself is a numeric value ranging from 0 to 100, the ADX Rating translates this into qualitative categories that help traders interpret the information more intuitively.
Common ADX Rating Categories:
-
0 – 19: Weak or No Trend
Indicates a sideways market or very weak trend. The market lacks clear direction, and trading in this environment may be risky. -
20 – 29: Weak Trend
A weak trend is present, but it is still difficult to determine its sustainability. The market is moving, but not strongly enough to be considered a reliable trend. -
30 – 39: Moderate Trend
The market is experiencing a moderate trend with some momentum. This is often seen as an ideal time to trade in trending strategies, but still requires caution. -
40 – 49: Strong Trend
A strong trend is underway, and the momentum is more reliable. Traders may consider this an optimal time to trade a strong trend. -
50 – 59: Very Strong Trend
The trend is well-established, and price movement is likely to continue in the current direction. However, caution is advised when nearing extreme levels, as reversals are more likely. -
60 – 100: Extremely Strong Trend
This indicates a very strong and persistent trend. While such trends are desirable, they can also signify that the market is nearing an exhaustion point and might reverse soon.
How to Use ADX Rating
-
Trend Assessment: ADX Rating helps traders determine if the market is strongly trending, or if it’s in a sideways or weak phase.
-
Confirm Entry/Exit Points: Traders can use ADX Rating to assess whether to enter or exit a trade:
-
Enter trades when the ADX Rating indicates a strong or very strong trend.
-
Avoid trades when the ADX Rating suggests a weak or no trend.
-
-
Filter Market Conditions: It can be used in combination with other indicators (like moving averages, RSI, or MACD) to filter markets, avoiding trades in low momentum periods.
Limitations
-
Lagging Indicator: Like the original ADX, the ADX Rating is based on past price action, so it does not predict future price movements.
-
No Directional Bias: It tells you the strength of the trend but not its direction. It must be combined with other indicators (e.g., +DI and –DI) for full decision-making.
Summary
The ADX Rating offers a simplified version of the traditional ADX, categorizing trends into easily understandable levels. This makes it easier for traders to evaluate market conditions, especially for those new to trading or who want quicker decision-making tools. By using the ADX Rating, traders can determine whether a market is trending strongly enough to warrant a trade or if they should wait for better conditions.
Q · 01How does ADX Rating differ from the standard ADX indicator?+
Q · 02What ADX Rating level signals a tradeable trend?+