
is a financial concept covered in this article. The Bullish Power Meter in Wilder's Directional Movement System
The goal of a successful trader is to make the best trades. Money is secondary.

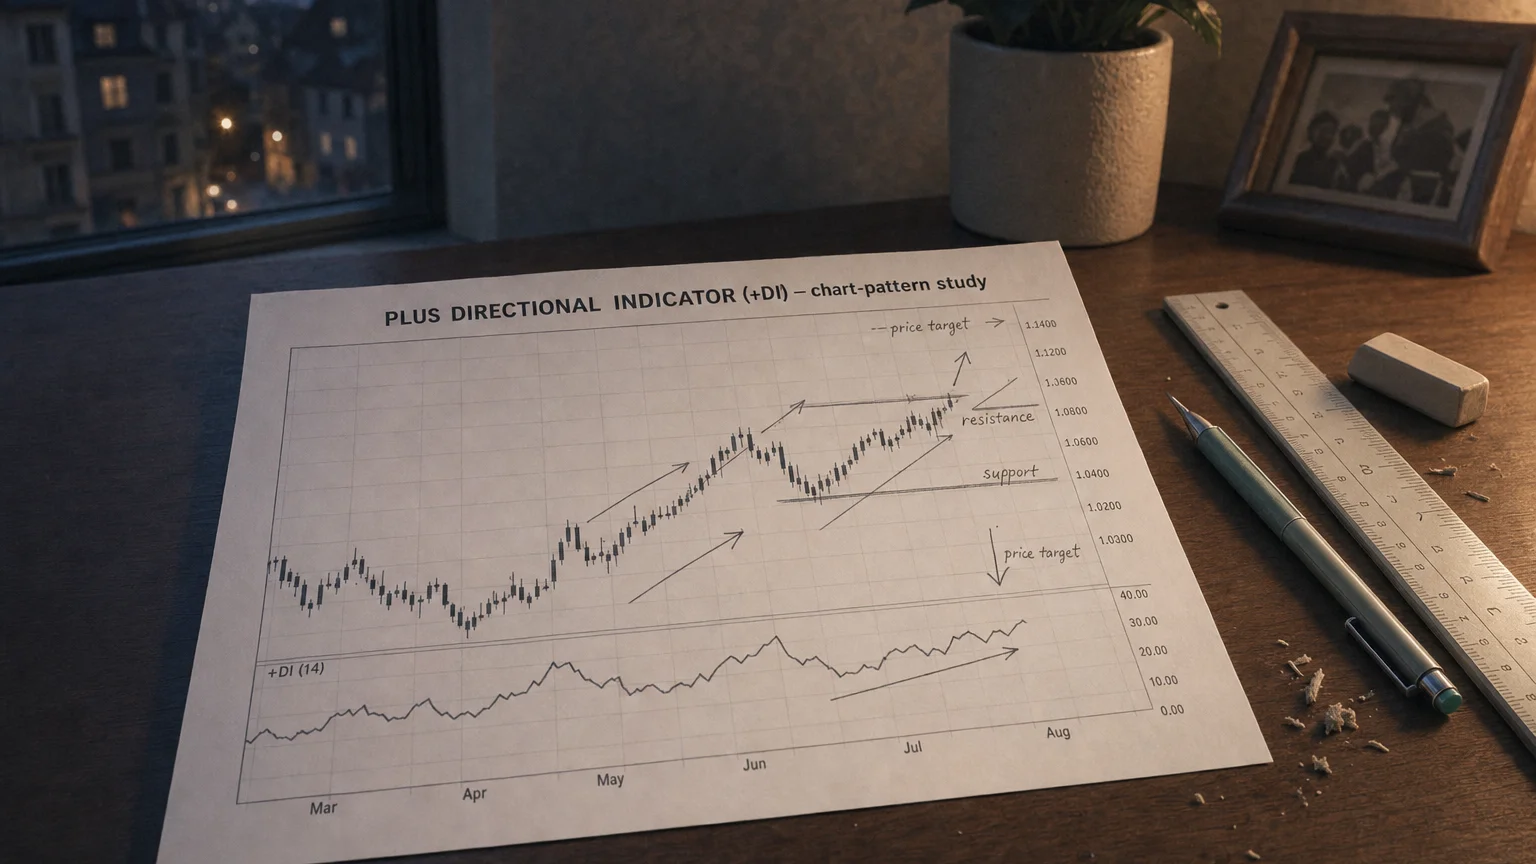
Meet the Plus Directional Indicator (+DI) – one half of J. Welles Wilder’s brilliant Directional Movement Index (DMI) suite. Think of +DI as the ‘bull strength’ gauge: it measures how powerfully prices are pushing upward compared to downward moves. When +DI is rising and sitting above its counterpart (-DI), the buyers are flexing their muscles and an uptrend is likely in charge. It’s the optimistic voice in the DMI conversation, telling you when the bulls have the upper hand.
How +DI Gets Calculated – The Bullish Recipe
Wilder cooked it up like this:
- +DM (Plus Directional Movement): Current high minus previous high (only if positive and larger than downward move; else 0).
- Smooth +DM over the period (usually 14) using Wilder’s smoothing (similar to early EMA).
- Divide smoothed +DM by smoothed Average True Range (ATR) to normalize.
- Result × 100 → +DI value (0 to 100 range).
In plain speak: +DI spikes when upside explosions outpace downside ones – pure bullish pressure.
Most platforms bundle +DI with -DI and ADX – you rarely plot it solo.
“The goal of a successful trader is to make the best trades. Money is secondary.”
— Alexander Elder, Author, Trading for a Living Trading for a Living (1993)
What +DI Is Really Telling You
Key behaviors to watch:
- +DI rising sharply: Bulls gaining traction – upward momentum building.
- +DI above -DI: Buyers in control – uptrend bias (classic DMI buy signal on crossover).
- +DI high but flattening: Upside pressure easing – possible consolidation or reversal brewing.
- +DI low (<20-ish): Bulls on vacation – weak or no uptrend.
Remember: +DI only speaks to bullish strength – pair it with -DI for the full tug-of-war story.
Practical Ways to Trade +DI
Battle-tested setups:
- Classic crossover: +DI crosses above -DI → go long (especially if ADX > 20–25 confirming strength).
- Trend confirmation: Price making higher highs + +DI staying dominant → stay long, trail stops.
- Pullback entry: In uptrend (+DI > -DI), wait for price dip, then enter when +DI holds or curls up again.
- Divergence hunt: Price new high but +DI lower high → weakening bulls, consider profit-taking.
Always check ADX – a +DI/-DI cross means little if trend strength (ADX) is weak (<20).
Strengths and the Usual Suspects (Limitations)
The Wins
- Clean measure of pure bullish directional pressure.
- Works beautifully with -DI and ADX for complete trend analysis.
- Robust across markets and timeframes – Wilder’s genius holds up decades later.
The Gotchas
- Lagging by nature – confirms moves after they start.
- Whipsaws in choppy ranges (+DI/-DI crossing repeatedly).
- No info on trend strength alone – needs ADX to filter junk signals.
Your +DI Quick-Start Checklist
- Plot full DMI: +DI, -DI, and ADX together.
- Focus on +DI > -DI crosses when ADX rising above 20–25.
- Confirm with price action (higher highs/lows) and volume if possible.
- Backtest crossover rules on your favorite assets.
- Use for bias, not standalone – let +DI shout ‘bulls in charge!’ before committing.
Q · 01What is Plus Directional Indicator?+