ADX Indicator How to Measure Trend Strength
The ADX indicator measures trend strength on a 0–100 scale. Learn how to read ADX values, combine +DI and -DI signals, and apply it to your trading strategy.

Overview
The ADX indicator measures trend strength on a 0–100 scale. Learn how to read ADX values, combine +DI and -DI signals, and apply it to your trading strategy.
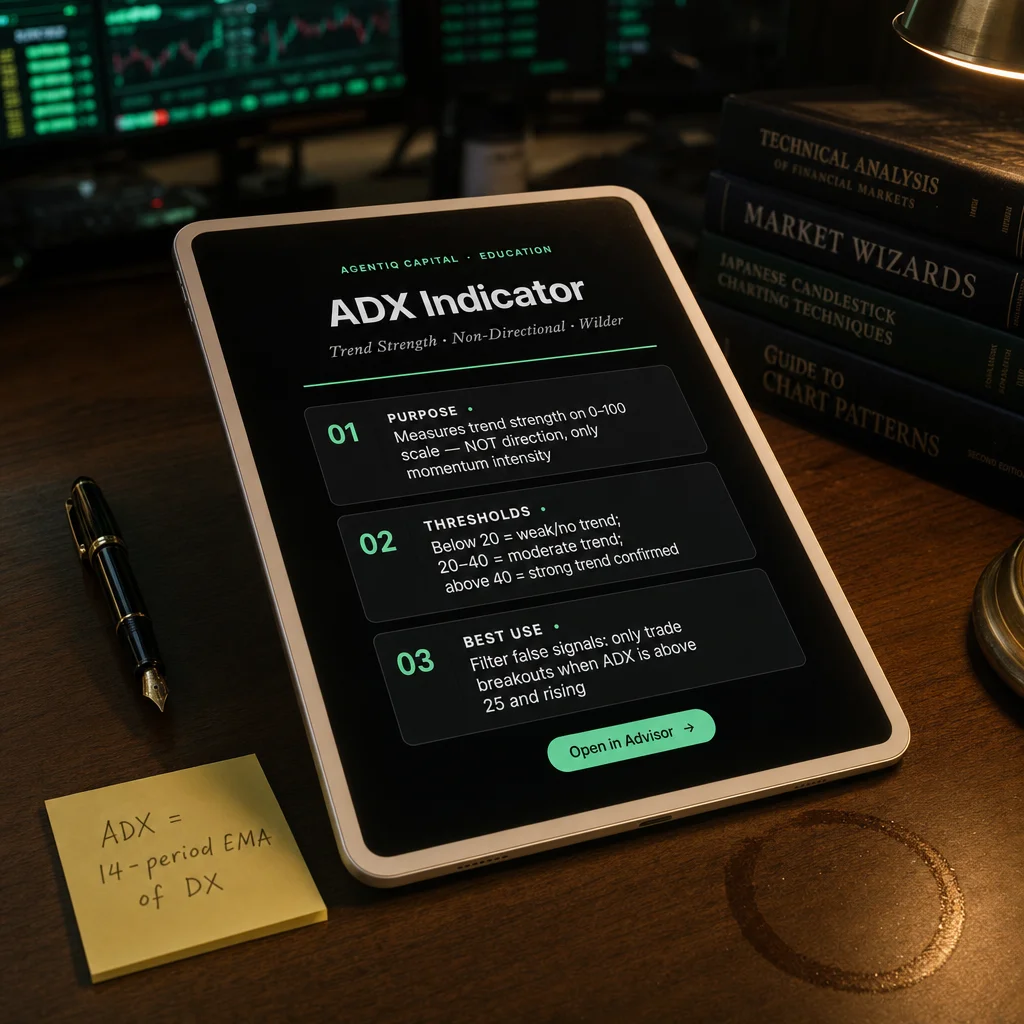
The Average Directional Movement Index (ADX) is a popular trend strength indicator developed by J. Welles Wilder Jr. It helps traders assess whether a market is trending and how strong that trend is, without indicating the direction of the trend.
Purpose
The ADX measures the strength of a trend, not its direction.
It helps answer:
“Is the market trending strongly, or is it moving sideways?”
Calculation Components
+DI (Positive Directional Indicator): Measures strength of upward movement.
–DI (Negative Directional Indicator): Measures strength of downward movement.
ADX Line: Smoothed average of the difference between +DI and –DI over a period (usually 14 days).
(Formula — visualization pending)
Typical lookback period = 14
Values range from 0 to 100
How to Interpret ADX
| ADX Value | Interpretation |
|---|---|
| 0–20 | Weak or no trend (sideways market) |
| 20–40 | Moderate trend |
| 40–60 | Strong trend |
| 60–100 | Very strong trend |
If +DI > –DI, the trend is upward.
If –DI > +DI, the trend is downward.
If ADX is rising, the trend is gaining strength.
If ADX is falling, the trend is losing strength—but may still continue.
Use Cases
Trend Confirmation: Helps confirm whether a trend-based strategy is suitable.
Avoiding Whipsaws: Helps traders stay out of choppy markets with weak trends.
Entry/Exit Signals: Combined with +DI/–DI crossovers, the ADX can signal:
Buy: +DI crosses above –DI and ADX > 20
Sell: –DI crosses above +DI and ADX > 20
Limitations
Lagging indicator: It reacts to price movements after they occur due to smoothing.
No directional bias: Needs to be paired with +DI/–DI or other tools for full signals.
Can be misleading in low-volume markets or with short timeframes.
Summary
The ADX is a powerful tool for measuring the strength of a trend, making it especially useful in trend-following strategies. While it does not indicate direction on its own, when combined with +DI and –DI lines, it helps traders determine whether to trade, hold, or wait. It's best used alongside other indicators for confirmation and timing.