The Chande Momentum Oscillator compares the sum of up-day gains to down-day losses over a lookback period, scaled to –100/+100, with no smoothing — delivering a faster, more symmetric momentum gauge than RSI.
The goal of a successful trader is to make the best trades. Money is secondary.

Created by quantitative wizard Dr. Tushar Chande (1994), the CMO is a bounded momentum indicator that swings between +100 and –100. It’s designed to measure the imbalance between gains and losses over a user-defined look-back period. Think of it as a high-gain amplifier for price strength and weakness—cleaner and louder than classic RSI because it treats up moves and down moves symmetrically and never smooths the raw data.
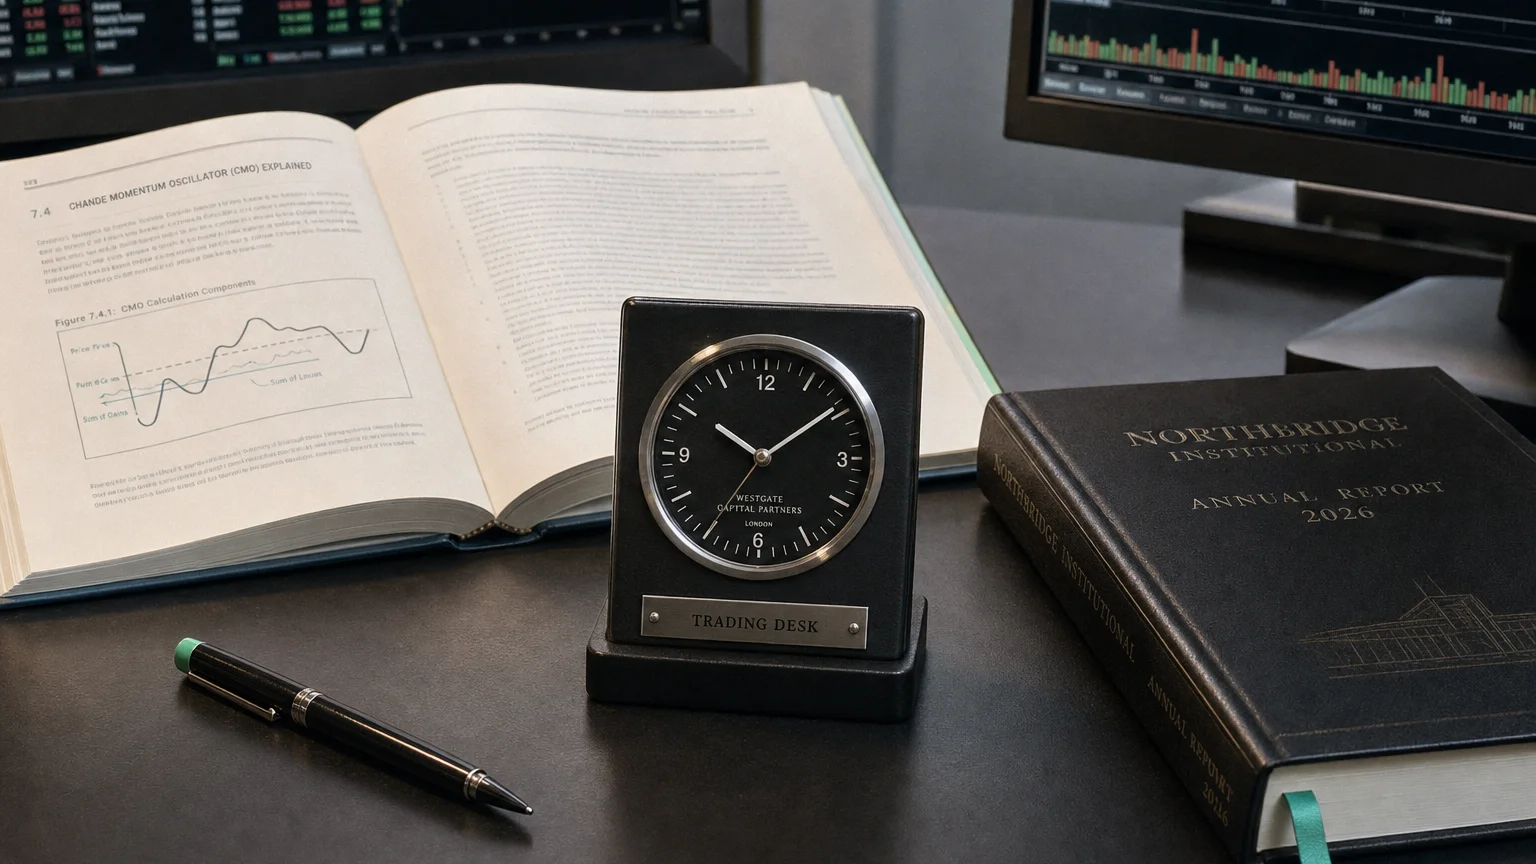
How It’s Calculated
For a chosen period N (14 is common, but 9 or 20 are popular tweaks):
- Sum of Advances (SU):
(Formula — visualization pending)
- Sum of Declines (SD):
(Formula — visualization pending)
- CMO:
(Formula — visualization pending)
Key quirks:
-
No smoothing, no absolute values—pure directional thrust.
-
Results are bounded, so overbought/oversold zones are easy to define.
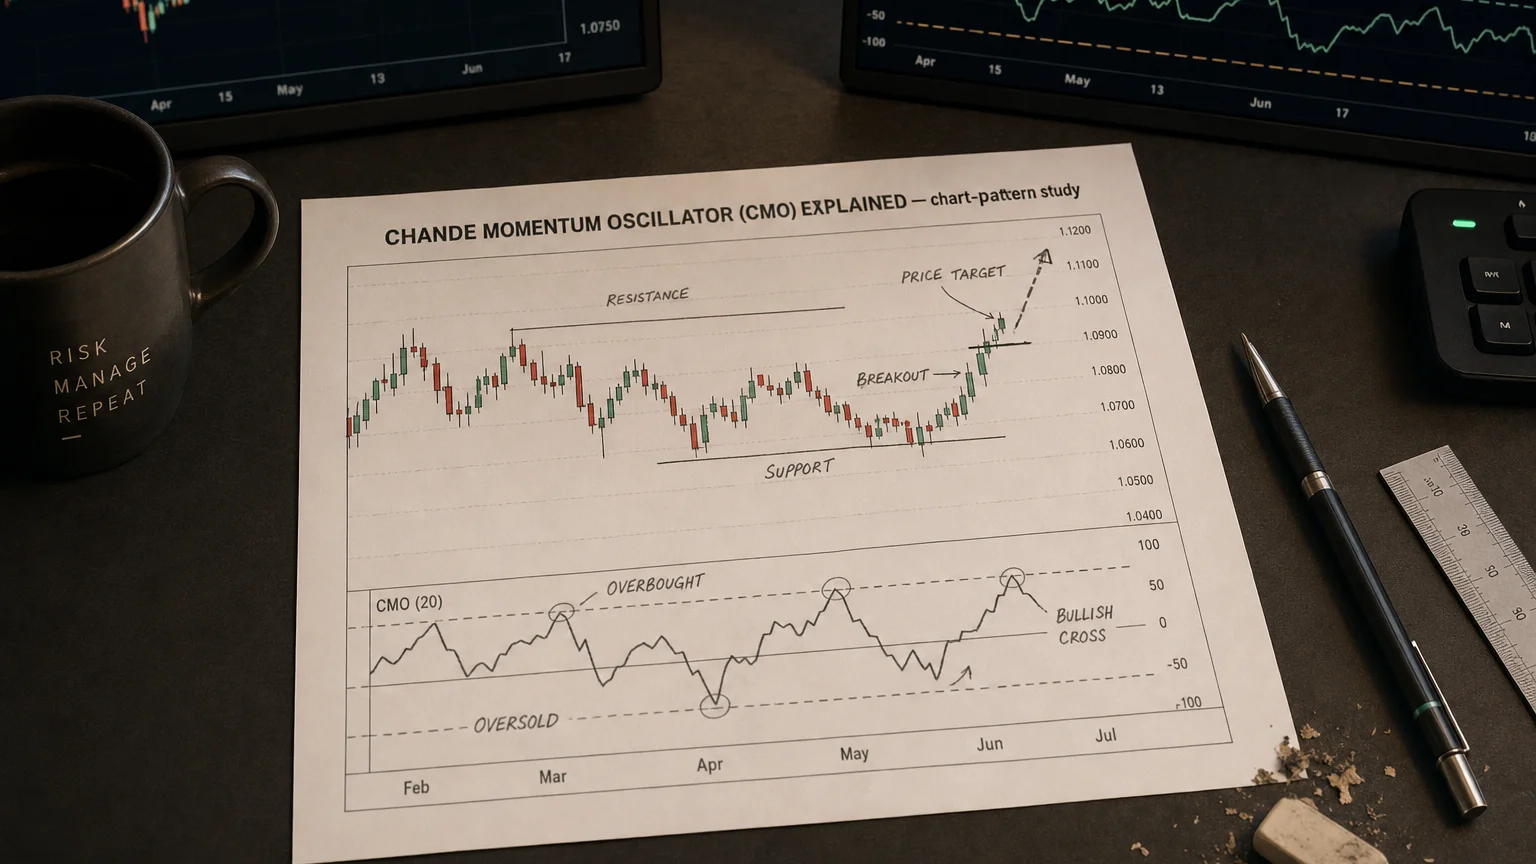
Reading the Oscillator
| Zone | Typical Thresholds | What It Suggests |
|---|---|---|
| +50 to +100 | Strong upside momentum | Potential overbought but shows real power; watch for exhaustion signals or trailing stops rather than automatic sells. |
| 0 | Midline | Tug-of-war equilibrium. Crosses above/below 0 flag emerging bullish/bearish pressure. |
| –50 to –100 | Strong downside momentum | Potential oversold; ripe for reversals, short covering, or at least tighter risk management on shorts. |
Signals to watch:
-
Threshold bounces: Price reacts when CMO tags ±50, ±70, or custom levels you back-test.
-
Centerline crosses: Momentum regime shifts—pair with moving-average filters.
-
Divergences: Classic momentum divergence setups; fix on +/–40 band for early warnings.
-
Band-pass systems: Chande suggested dual thresholds (e.g., +50/–50) to stay in trend, exiting only when CMO crosses back inside the band.
Parameter & Tweaking Tips
| Market Type | Period NNN | Notes |
|---|---|---|
| Fast-moving (intraday FX, futures) | 9–13 | Captures quick bursts; may generate whipsaws—combine with volatility filter. |
| Swing trading equities | 14–20 | The “classic” setting; balances responsiveness and noise. |
| Position/weekly charts | 25–35 | Smooths random churn, focuses on primary trend shifts. |
Pro tip: Because CMO is unsmoothed, volatility spikes can yank it to extremes. Many pros take a moving average of the CMO itself (e.g., 3-period SMA) to mellow the whiplash without losing the directional purity.
Blending with Other Tools
-
Trend filter: Use a 50-SMA or ADX > 25 to trade only CMO signals with the prevailing trend.
-
Volatility stop (ATR): Pair CMO overbought/oversold entries with ATR-based exits.
-
Volume confirmation: Look for volume expansion when CMO leaves extreme zones—adds conviction.
-
Multi-time-frame stack: E.g., weekly CMO trend bias + daily CMO pullbacks = high-probability swing entries.
Strengths & Caveats
Pros
-
Bounded scale simplifies thresholds.
-
Symmetric treatment of gains/losses (unlike RSI’s different math for up/down moves).
-
Zero lag from smoothing means lightning-fast response.
Cons
-
That same lack of smoothing = choppy in low-volatility ranges.
-
Extreme readings persist in strong trends—use filters to avoid premature counter-trend trades.
-
Purely price-based; lacks volume or volatility context unless you add it.
Key Takeaways (The Encore)
-
CMO = Momentum amplifier bounded ±100, ideal for spotting exhaustion and confirming trend vigor.
-
Watch ±50 (or ±70) for classic overbought/oversold levels; adjust for asset volatility.
-
Zero-line flips highlight regime changes—potent when aligned with bigger-picture trend.
-
Blend, don’t depend: add trend, volatility, and volume overlays to tame false signals.
-
Back-test your thresholds; the “right” level depends on asset class, timeframe, and your risk appetite.
Now you’re armed to riff with the Chande Momentum Oscillator like a pro. Plug it into your charting station, tweak the gain, and let the momentum music guide your trades. Rock on!
Q · 01How does the Chande Momentum Oscillator differ from RSI?+
Q · 02What do the ±50 levels mean on the CMO?+
Q · 03What period setting should traders use for the CMO?+