1-Day ROC of Triple Smooth EMA Explained
The 1-day rate of change of a triple smooth EMA measures daily momentum on a heavily filtered base, cutting noise while preserving genuine trend signals.

Overview
The 1-day rate of change of a triple smooth EMA measures daily momentum on a heavily filtered base, cutting noise while preserving genuine trend signals.
The 1-Day Rate-of-Change (ROC) of a Triple Smooth EMA is a clever hybrid momentum indicator that starts with a heavily smoothed Exponential Moving Average (three EMAs nested together for buttery curves) and then takes its simple one-day change. The triple smoothing kills short-term noise and random wiggles, leaving a clean line that only moves when real daily momentum shifts. The 1-day ROC then turns that into a crisp momentum reading – positive for up-day strength, negative for down-day pressure. It's the calm, reliable way to gauge short-term momentum without getting rattled by intraday chaos.
How It's Built – Triple Smooth + One-Day Punch
Step by step:
- EMA1: Standard EMA of price (period N).
- EMA2: EMA of EMA1 (same N).
- EMA3: EMA of EMA2 (same N) – your triple-smoothed base.
- 1-Day ROC: EMA3_today − EMA3_yesterday (or percentage version).
Result: A momentum reading that ignores intraday jitter but reacts cleanly to genuine daily shifts.
Some versions use T3 (Tillson's triple) instead of plain nested EMAs – even smoother.
"The technician believes that anything that can possibly affect the price—fundamentally, politically, psychologically, or otherwise—is actually reflected in the price of that market."
— John J. Murphy, Former Director of Technical Analysis at Merrill Lynch, CMT Association founder Technical Analysis of the Financial Markets: A Comprehensive Guide to Trading Methods and Applications (1999)
Reading the Momentum Line
Simple interpretations:
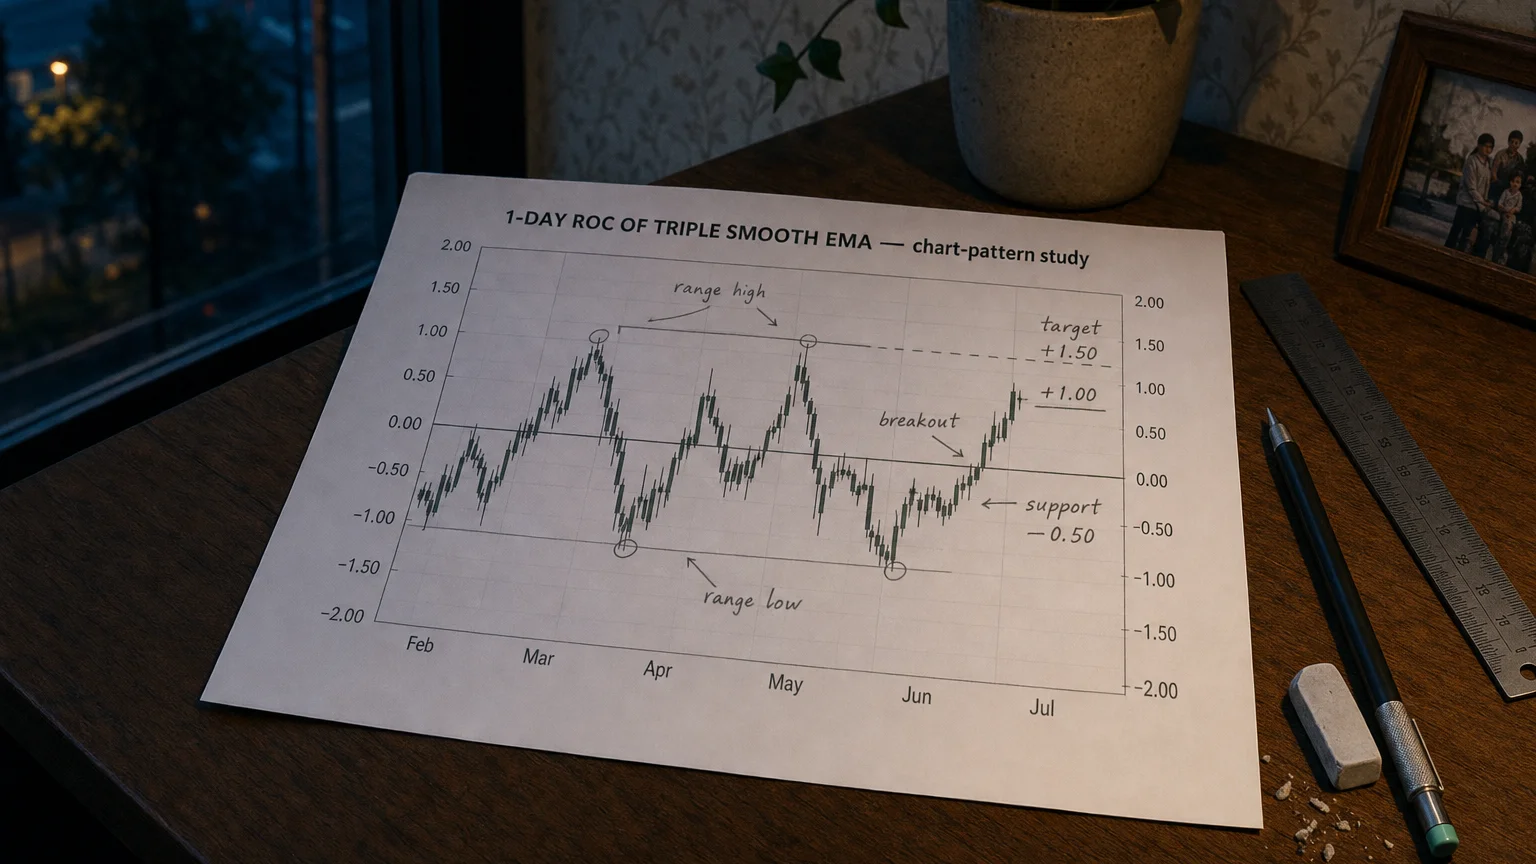
- Positive and rising: Daily upside momentum building – bullish bias.
- Negative and falling: Downside pressure strengthening – bearish.
- Crossing zero up: Momentum turning bullish – potential buy signal.
- Crossing zero down: Momentum turning bearish – caution or short setup.
- Flat near zero: Choppy or consolidating – low conviction.
Because of heavy smoothing, crosses are rare and meaningful – fewer false signals.
Parameter Choices – Smoothing vs Speed
The base EMA period N controls everything:
- Short (14–21): More responsive – catches momentum shifts quicker, some noise.
- Medium (34–50): Sweet spot for daily charts – clean signals.
- Long (100+): Ultra-smooth – macro daily momentum only.
Longer N = calmer line, fewer zero crosses, higher significance.
Pro Trading Setups
Effective ways to use it:
- Zero-line momentum: ROC >0 + price > 200-EMA → strong bullish bias.
- Early trend warning: ROC crosses zero while price still flat → momentum leading price.
- Pullback filter: In uptrend, wait for ROC dip near zero then cross up → safer re-entry.
- Divergence: Price higher high + lower ROC peaks → weakening trend.
The triple smoothing makes this ROC slower but much more reliable than raw price ROC.
Smart Combinations
Pair for power:
- Trend filter: Long-term MA or ADX – only positive ROC in uptrends.
- Volume: ROC surge + volume increase = conviction.
- Price action: Zero cross + bullish candle = higher probability.
- Oscillators: Use with RSI for divergence confirmation.
Strengths and Realistic Limits
The Wins
- Heavy smoothing kills noise – clean, meaningful daily momentum.
- Fewer false signals than raw or lightly smoothed ROC.
- Great for spotting genuine momentum shifts and divergences.
- Works well on daily and higher timeframes.
The Gotchas
- Lags more than raw momentum – signals come later.
- Very quiet in ranges – few crosses.
- Less useful intraday – smoothing too heavy for short horizons.
Your Triple Smooth ROC Checklist
- Start with N=34–50 for daily charts.
- Plot zero line and watch crosses carefully.
- Require trend/volume confirmation.
- Use longer N on higher timeframes.
- Monitor divergences – often early warnings.
- Backtest significance of zero crosses per asset.