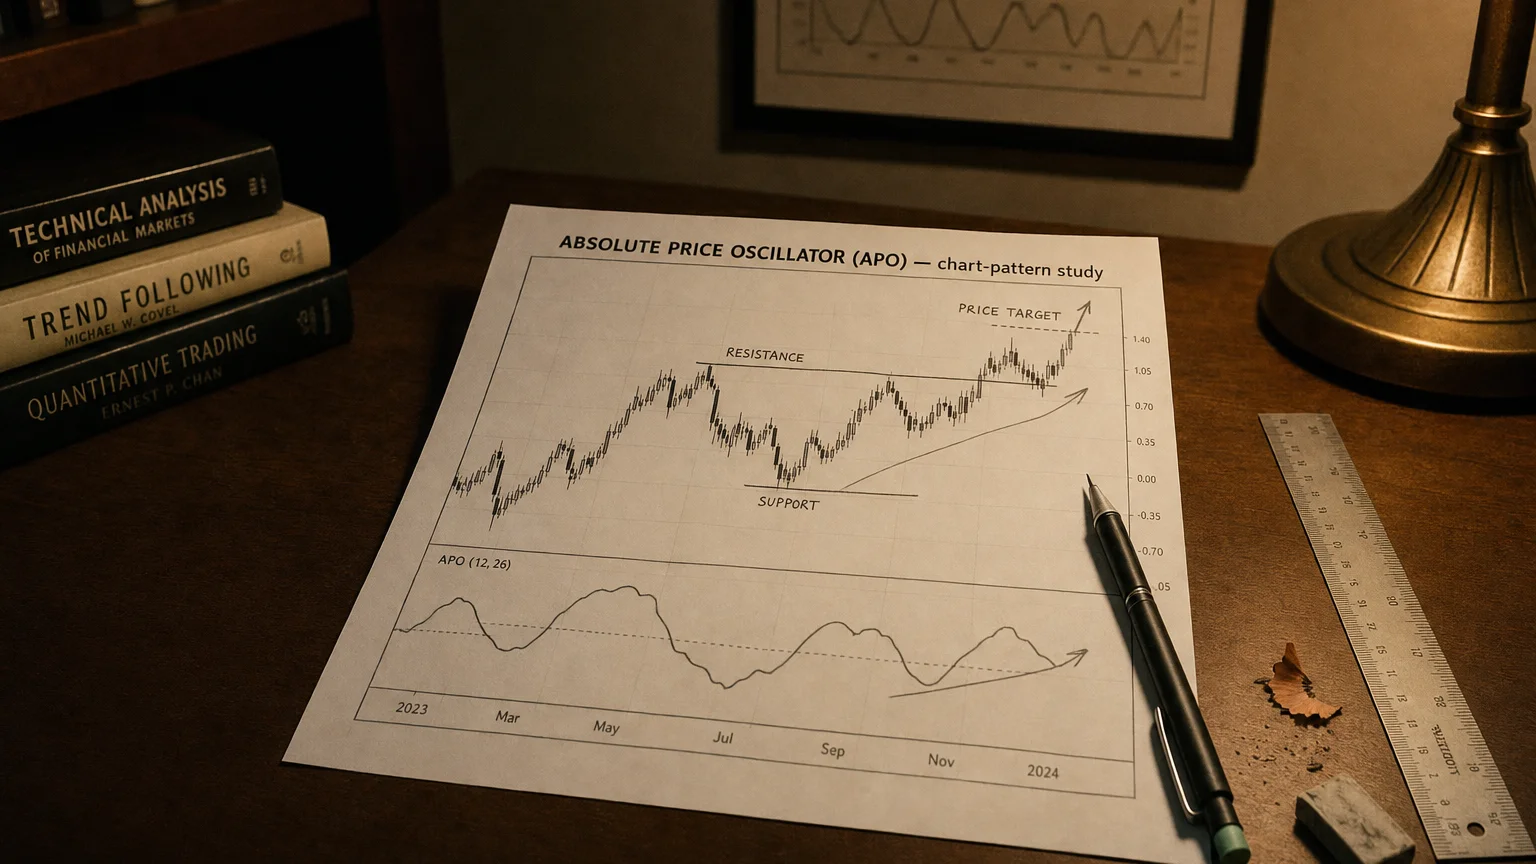
Absolute Price Oscillator (APO) Raw EMA Momentum Explained
The Absolute Price Oscillator (APO) subtracts a long EMA from a short EMA to expose raw momentum direction and strength — a streamlined MACD alternative.

Overview
The Absolute Price Oscillator (APO) subtracts a long EMA from a short EMA to expose raw momentum direction and strength — a streamlined MACD alternative.
The Absolute Price Oscillator (APO) is a momentum-based technical indicator that measures the difference between two exponential moving averages (EMAs) of a security's price. It is used to identify trend direction, momentum shifts, and potential buy/sell signals. The APO is conceptually similar to the MACD (Moving Average Convergence Divergence), but it focuses on the absolute price difference between EMAs rather than percentage change.
Formula
(Formula — visualization pending)
Where:
EMAₛₕₒᵣₜ = shorter-period exponential moving average (e.g., 12 periods)
EMAₗₒₙg = longer-period exponential moving average (e.g., 26 periods)
The difference between these two EMAs represents the absolute momentum of price movement.
How to Interpret APO
Positive APO values indicate bullish momentum (short-term EMA is above long-term EMA).
Negative APO values indicate bearish momentum (short-term EMA is below long-term EMA).
Crosses above zero can signal potential buy opportunities.
Crosses below zero may signal potential sell opportunities.
The further from zero the line moves, the stronger the momentum.
Use Cases
Trend Identification: Helps identify the direction and strength of a trend.
Momentum Shifts: Detects changes in price momentum, useful for anticipating reversals.
Entry/Exit Signals:
Buy Signal: When APO crosses above zero.
Sell Signal: When APO crosses below zero.
APO vs. MACD
| Feature | APO | MACD |
|---|---|---|
| Output | Absolute difference of EMAs | Also absolute, but commonly paired with signal line |
| Use Case | Emphasizes raw price changes | Emphasizes rate of change |
| Signal Line | Not always included | Includes a signal line EMA |
| Visuals | Cleaner for analyzing raw price momentum | More common in platforms/trading systems |
Limitations
Like all moving average-based indicators, the APO is lagging, meaning it reacts after price movement occurs.
May generate false signals in sideways or low-volatility markets.
Should be used in combination with other indicators (e.g., volume, RSI) for confirmation.
Summary
The Absolute Price Oscillator (APO) is a useful technical indicator that helps traders evaluate momentum and trend direction by comparing two EMAs. It is especially valuable in trend-following strategies and for spotting momentum reversals, though it’s best used with complementary tools to reduce false signals in non-trending markets.