is a financial concept covered in this article. The Locked-and-Loaded Classic Momentum Oscillator
The most important rule of trading is to play great defense, not great offense.
Most platforms give you two MACD flavors: the fully editable one where you can tweak everything, and the MACD Fix 12/26 – the ‘factory-preset’ version with the fast and slow EMAs permanently glued to Gerald Appel’s original 12 and 26 periods. The signal line (usually 9) might still be adjustable, but the core engine is frozen. Why bother? It enforces consistency across every chart and symbol, kills the urge to curve-fit after a bad trade, and leverages decades of baked-in research. It’s the disciplined, no-fuss momentum workhorse.
“The most important rule of trading is to play great defense, not great offense.”
— Paul Tudor Jones, Founder of Tudor Investment Corporation, hedge fund manager Market Wizards: Interviews with Top Traders, Jack D. Schwager (New York Institute of Finance, 1989), chapter “Paul Tudor Jones — The Art of Aggressive Trading” (1989)
Why Lock the 12 and 26? The Real Reasons
This isn’t just nostalgia – there’s method to the freeze:
- Ironclad consistency: Scan hundreds of symbols with the exact same momentum yardstick – no accidental tweaks throwing off comparisons.
- Historical goldmine: Decades of books, studies, and strategies built exactly on 12-26-9.
- Discipline enforcer: Removes the temptation to ‘optimize’ lengths after every losing trade.
Same subtraction math as regular MACD – just with non-negotiable inputs.
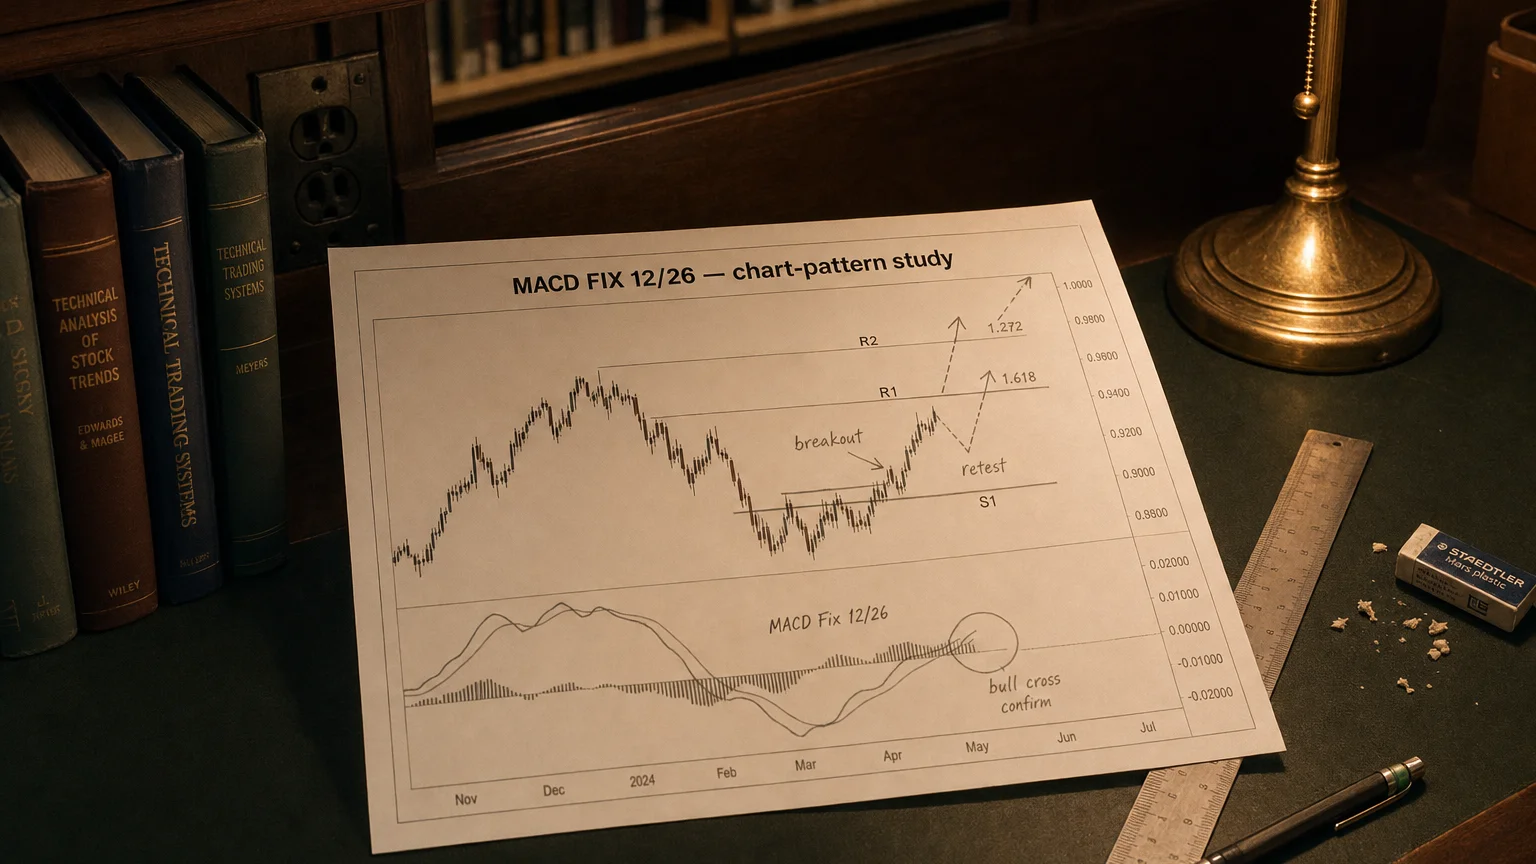
Reading the Pulse – Histogram Tells the Story
The Fix version often shows just the histogram (MACD Line minus Signal) for a cleaner pane:
- Histogram flips above zero: Fast 12-EMA crosses above slow 26-EMA – bullish momentum kicking in.
- Histogram expanding upward: Trend accelerating – ride it while it lasts.
- Histogram peaks then shrinks: Momentum tiring – time to scale out or tighten stops.
- Histogram flips below zero: Bearish crossover – sellers taking control.
- Bullish divergence (price lower lows, histogram higher lows): Potential reversal brewing.
- Bearish divergence (price higher highs, histogram lower highs): Upside running out of steam.
The Few Tweaks You Still Get to Play With
It’s not completely locked down:
- Signal length (7–13): Shorter = earlier signals (more noise); longer = smoother (later entries).
- Data source: Close vs HL2 (high+low/2) vs Heikin-Ashi – great for gappy or wicky assets.
- Visual style: Color change at zero, add the signal line, or keep pure histogram.
Intraday crypto warriors often drop signal to 7 for quicker triggers; daily stock traders stick closer to 9 or bump to 11 for calm.
Battle-Tested Playbooks
Simple, robust setups that work with the fixed settings:
- Zero-Line Surge: Histogram crosses from negative to positive + price breaks recent swing high → go long. Stop below pivot low, trail with ATR.
- Pullback Reload: In uptrend (e.g., price > 200-SMA), wait for histogram to dip near/below zero then curl up → enter on strong candle.
- Divergence + Confirmation: Spot bullish divergence at support → enter on engulfing or pin bar → watch histogram for follow-through.
Strengths, Weaknesses, and Reality Check
The Awesome
- Perfect for multi-asset scanning on identical settings.
- Clean, uncluttered histogram view cuts visual noise.
- Massive community support and historical precedent.
The Trade-Offs
- One-size-fits-most – not optimized for ultra-fast (1-min) or glacial (monthly) charts.
- Pure histogram can hide subtle MACD/signal double-cross patterns.
- Still built on EMAs – will lag violent, news-driven reversals.
Your MACD Fix 12/26 Launch Checklist
- Choose timeframe – shines brightest on H1 to daily charts.
- Decide display style: pure histogram or add signal line.
- Backtest zero-crosses, pullbacks, and divergences on your instruments.
- Layer higher-timeframe trend and key S/R for context.
- Set alerts for histogram flips, slope changes, or divergence.
- Review when volatility regime shifts – tweak signal length if needed.
Q · 01What is Macd Fix 12 26 Factory Preset Momentum Oscillator?+