is a financial concept covered in this article. The MACD's Percentage-Based Cousin for Scale-Invariant Momentum
The technician believes that anything that can possibly affect the price—fundamentally, politically, psychologically, or otherwise—is actually reflected in the price of that market.
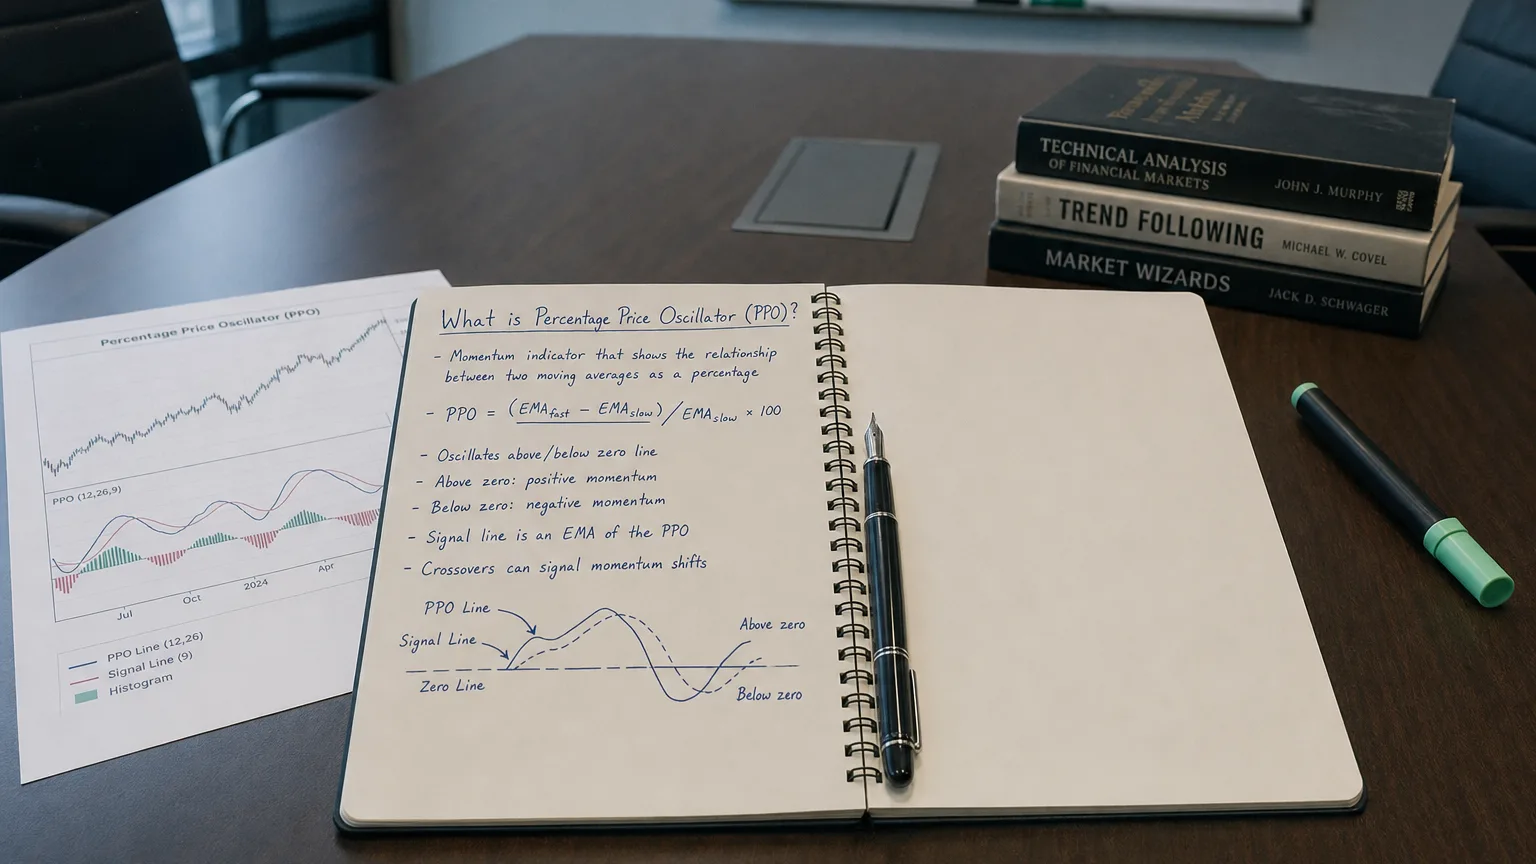
The Percentage Price Oscillator (PPO) is the relative-strength version of the MACD family. Instead of subtracting two EMAs (absolute difference like MACD or APO), it expresses that difference as a percentage of the longer EMA. This normalization makes PPO perfect for comparing momentum across assets with wildly different price levels – a 1000 stock can be judged on the same momentum scale. It’s the go-to for multi-asset scans, relative strength analysis, and cleaner signals when absolute values would mislead.
The Math – Percentage Normalization
Clean formula:
PPO = \left( \frac{EMA_{short} - EMA_{long}}{EMA_{long}} \right) \times 100
- EMA_{short}: Faster EMA (usually 12)
- EMA_{long}: Slower EMA (usually 26)
- Signal line: Often 9-period EMA of PPO
Histogram = PPO − Signal (just like MACD).
Classic 12,26,9 mirrors MACD settings – direct percentage equivalent.
“The technician believes that anything that can possibly affect the price—fundamentally, politically, psychologically, or otherwise—is actually reflected in the price of that market.”
— John J. Murphy, Former Director of Technical Analysis at Merrill Lynch, CMT Association founder Technical Analysis of the Financial Markets: A Comprehensive Guide to Trading Methods and Applications, Prentice Hall / New York Institute of Finance, 1999, Chapter 1 (“The Philosophy of Technical Analysis”), p. 2 (1999)
Reading PPO – Familiar MACD Signals, Better Scaling
Interpret like MACD, but percentage-based:
- Positive PPO: Short EMA > long EMA – bullish momentum.
- Negative PPO: Short EMA < long EMA – bearish momentum.
- Crossing above zero: Momentum turning bullish.
- Crossing below zero: Momentum turning bearish.
- Signal cross: PPO crossing signal line – buy/sell triggers.
- Histogram expansion: Accelerating momentum.
- Divergence: Price new high + lower PPO peak → weakening trend.
Extremes comparable across assets – +2% means similar relative strength everywhere.
PPO vs MACD/APO
Quick comparison:
- PPO: Percentage – great for cross-asset and relative strength.
- MACD: Absolute – sensitive to price level, classic histogram.
- APO: Raw absolute difference – simplest momentum diff.
Use PPO when comparing momentum between high-priced and low-priced instruments.
Practical Trading Setups
Effective plays:
- Signal cross: PPO crosses above signal → buy; below → sell/short.
- Zero-line momentum: PPO >0 + rising → strong bullish bias.
- Relative strength scan: Rank assets by PPO value – highest = leaders.
- Divergence reversal: Bearish divergence + PPO crossing zero → short setup.
- Histogram surge: Expanding bars → accelerating trend, add positions.
In trends, treat extremes as continuation – don’t fade strong PPO moves blindly.
Tuning Parameters
Period choices:
- Fast (10/20/9): Responsive – intraday and volatile markets.
- Classic (12/26/9): Standard swing timing.
- Slow (26/52/9): Smoother for position trading.
Strengths and Limitations
The Wins
- Percentage scale – true relative momentum across any price level.
- Same trusted MACD signals with better comparability.
- Excellent for sector/asset ranking and scans.
- Clean divergences and histogram.
The Gotchas
- Still lagging – based on past EMAs.
- Whipsaws in ranges – multiple crosses around zero.
- Less common than MACD – fewer pre-built strategies.
Your PPO Launch Checklist
- Start with classic 12/26/9 settings.
- Plot zero line, signal, and histogram.
- Use for multi-asset relative strength scans.
- Add trend/volume confirmation on signals.
- Watch divergences and histogram for acceleration.
- Backtest cross performance per market type.