All Moving Average (AMA) Indicator Explained
The AMA indicator bundles SMA, EMA, HMA, VWMA and more into one tool. Switch MA types instantly, add multi-timeframe overlays, and clean up your charts.
Overview
The AMA indicator bundles SMA, EMA, HMA, VWMA and more into one tool. Switch MA types instantly, add multi-timeframe overlays, and clean up your charts.
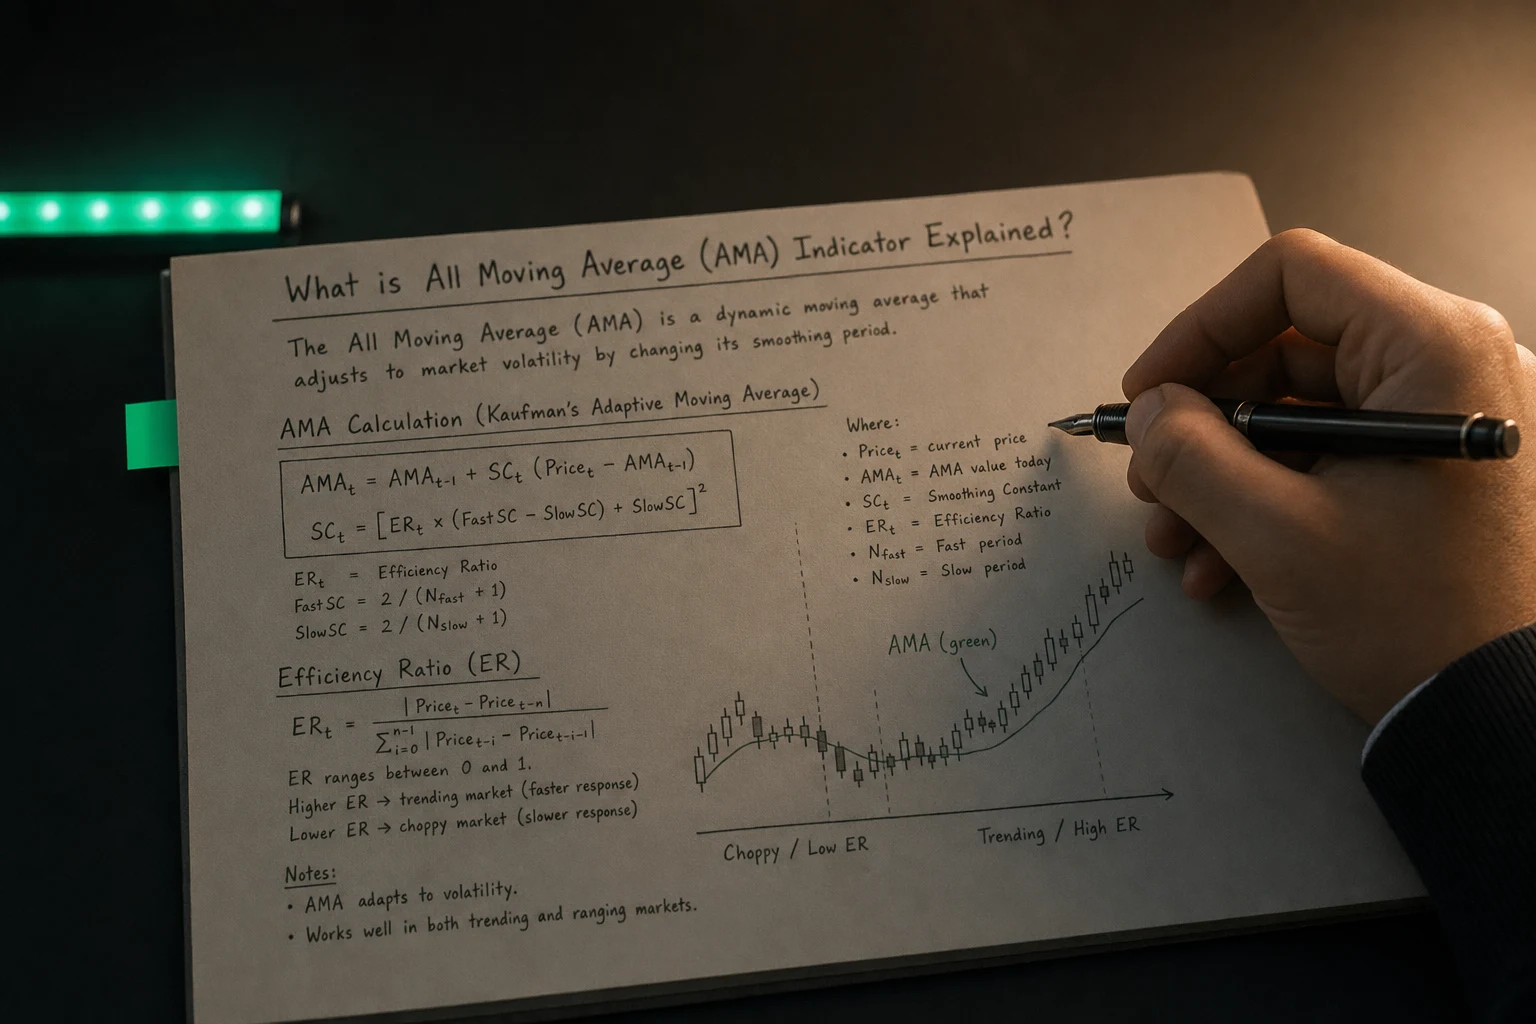
The All Moving Average indicator (sometimes called “AMA” on MetaTrader platforms, not to be confused with Adaptive or Kaufman AMA) is a wrapper that lets you plot any major moving-average flavor from a single tool. Instead of juggling multiple MA indicators, you simply select:
Calculation method – SMA, EMA, WMA, SMMA, HMA, TMA, VWMA, etc.
Source price – Close, Open, High, Low, Median, Typical, or even another indicator’s values.
Period & shift – Length (N) and optional forward/backward displacement.
Timeframe override – Plot a higher- or lower-timeframe MA on the chart you’re watching.
Goal: unify your moving-average workflow so trend, support/resistance, and signal lines are all produced by one flexible engine.
Popular MA Types Inside the Package
| Method | Core Formula & Traits | Best Use-Cases |
|---|---|---|
| SMA (Simple) | Arithmetic mean of last N prices | Baseline trend, long cycles |
| EMA (Exponential) | *(Formula — visualization pending)* weights recent data |
Momentum, fast crossovers |
| WMA (Linear Weighted) | Linearly increasing weights (newest × N, … oldest × 1) | Smoother than EMA without as much lag |
| SMMA (Smoothed) | SMA seed, then EMA with very small α\alphaα | Filtering noise, long-term bias |
| TMA (Triangular) | SMA of an SMA (or WMA of WMA) | Ultra-smooth center-weighted curve |
| HMA (Hull) | Combines WMAs of different lengths, then sqrt(N) smoothing | Very fast yet smooth trend capture |
| VWMA (Volume-Weighted) | Price weights multiplied by volume before averaging | Futures, crypto, where volume matters |
Most AMA scripts expose a dropdown for “Method = 0…6” (or similar) to toggle between these.
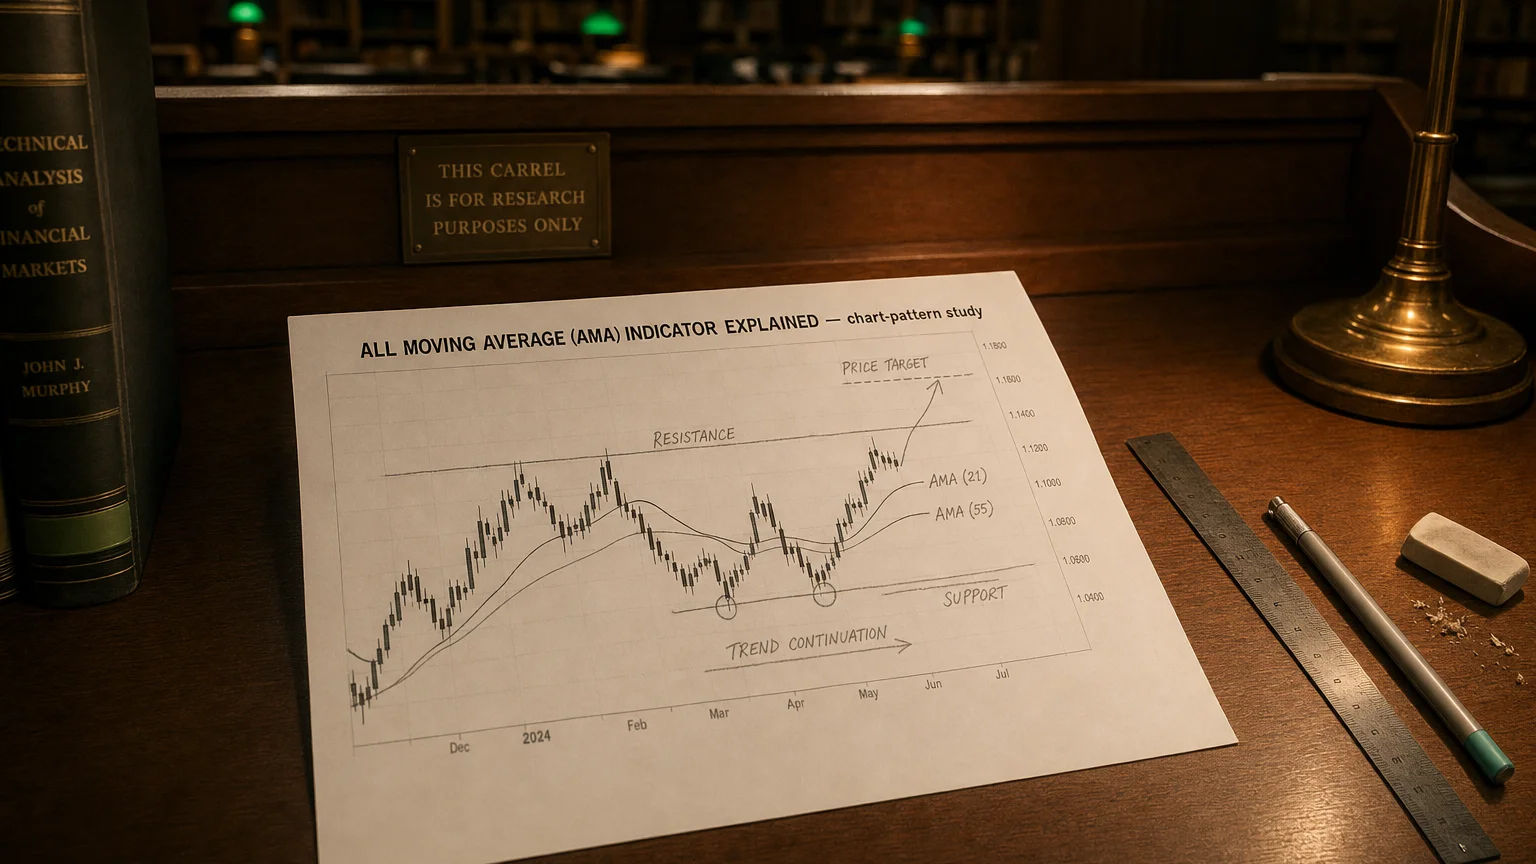
Reading & Using the AMA
| AMA Behaviour | Typical Interpretation | Sample Tactics |
|---|---|---|
| Price above rising AMA | Bullish trend intact | Trade pullbacks to the line, trail stops below it |
| Price crosses above AMA | Momentum shift to bulls | Entry trigger if volume confirms |
| AMA flattens | Range or base building | Switch to mean-reversion or wait |
| Price far from AMA (z-score > 2) | Overextension | Take profits or fade on divergence |
Classic strategies (golden/death cross, bounce off the 20-EMA, 200-SMA dynamic support) transplant directly—AMA just streamlines the config.
Key Parameters & Tweaks
| Parameter | Why It Matters | Pro Tips |
|---|---|---|
| Period (N) | Sets the look-back length → lag vs. smoothness | Short (9–20) for scalps, medium (34–55) for swings, long (100–200) for macro bias |
| Method | Controls responsiveness | Test EMA vs. HMA on your asset’s volatility profile |
| Source Price | High vs. Close can change line placement | Use HL2 (average of High & Low) on wicky instruments |
| Shift | Moves line forward/back | Positive shift can anticipate support zones; negative for centerline alignment |
| Timeframe | Multi-TF context on one chart | Overlay the 4-hour 50-EMA onto a 15-min chart for bigger-picture bias |
Combining AMA with Other Indicators
| Companion Tool | Synergy |
|---|---|
| MACD / RSI | Confirm that momentum oscillators agree with AMA direction |
| ATR Bands | Build dynamic envelopes around AMA for trend-pullback entries |
| Volume Profile | Validate that price-AMA cross happens at high-volume nodes |
| Price Action | Wait for engulfing candles or pin-bars right on the AMA line |
Strengths & Caveats
| Strengths | Limitations |
|---|---|
| “One ring” to test every MA variant | Doesn’t create new math—just aggregates it |
| Multi-timeframe plotting saves chart space | Too many overlays can clutter quickly |
| Fast R&D: change methods without re-adding indicators | Easy to curve-fit if you tweak endlessly |
| Supports custom price inputs (e.g., RSI-based MA) in many versions | Some platforms script-locked to basic MA set |
Implementation Checklist
Define objective – trend-following, mean-reversion, or volatility filter?
Select MA method & period to match that objective.
Back-test on historical data; watch for robustness across markets & regimes.
Layer confirmation – e.g., only take EMA-cross buys when RSI > 50.
Automate alerts – many AMA tools let you trigger on slope change, cross, or distance.
Review quarterly – volatility regimes shift; your “perfect” length might need tuning.
Bottom Line
The All Moving Average Indicator is less a single metric and more a Swiss-Army MA toolkit. It empowers you to prototype, compare, and deploy every major moving-average flavor without bloating your chart.
Master it, and you can dial in the right smoothing for any market tempo—whether you’re day-trading micro futures or swinging blue-chip equities.
Plug it in, fine-tune the strings, and let your moving-average symphony shred the noise.