is a financial concept covered in this article. The Near-Real-Time Trend Tracker That Outsmarts Lag
The goal of a successful trader is to make the best trades. Money is secondary.

The Hilbert Transform – Phasor Components indicator lets you look at price through a signal-processing lens. By running a discrete Hilbert transform on a detrended price stream, it splits every bar into two orthogonal streams—an In-Phase component that mirrors the raw price and a Quadrature component that is shifted ahead by 90 degrees. Together those streams form an analytic signal: a rotating “phasor” whose length measures the instantaneous amplitude (how energetic the current cycle is) and whose angle pinpoints the instantaneous phase (where the market sits inside that cycle).
Why bother? Because most chart indicators assume a fixed look-back, yet real markets breathe—cycles stretch in quiet trends and compress in volatile chop. The phasor data updates every bar. This reveals the dominant wavelength and its position in real time. Feed that information into adaptive moving averages, oscillators, or custom entry rules and you gain tools that retune themselves to the market’s current rhythm instead of yesterday’s antiquated losses. In short, HT-Phasor is a DSP lens that extracts a market’s live “vector” of amplitude & phase: HT-Phasor Components provide the raw coordinates—amplitude, phase, and implied period—that can turn static strategies into dynamic, cycle-synced ones.
From price to analytic signal
For a real-valued series xtx_txt (close or median price) the analytic signal is
(Formula — visualization pending)
where
-
(Formula — visualization pending)
-
(Formula — visualization pending)
-
(Formula — visualization pending)
(Formula — visualization pending)
On a chart this is approximated with a short finite-impulse-response (FIR) filter.
A popular 7-tap causal kernel (coefficients rounded) is
(Formula — visualization pending)
Core phasor equations
| Quantity | Formula | Insight |
|---|---|---|
| Instantaneous amplitude | (formula) | Real-time cycle “energy” / volatility |
| Instantaneous phase | (Formula — visualization pending) | Cycle position inside 0–360° |
| Instantaneous frequency | (formula) | Phase change per bar |
| Dominant period | (Formula — visualization pending) | Current market wavelength |
A complete 360° rotation of ϕ\phiϕ marks one cycle.
Pre-processing best practice
- Detrend with a two-pole high-pass or short EMA to remove slow drift:
(Formula — visualization pending)
-
Feed sts_tst to the FIR Hilbert kernel for QtQ_tQt.
-
Phase unwrapping – add or subtract 2π2\pi2π whenever ϕ\phiϕ jumps > π so phase remains continuous.
Trading applications
-
Cycle-Timed Entries:
(Formula — visualization pending) -
Adaptive Look-Backs:
(Formula — visualization pending) -
Trend Confirmation:
(Formula — visualization pending) -
Volatility Regime:
(Formula — visualization pending)
Because the phasor simultaneously supplies where (phase) and how strong (amplitude), strategies adapt to changing market rhythms without manual retuning.
Strengths & watch-outs
Pros
-
Captures the current cycle rather than a fixed look-back.
-
Ultra-low lag—updates with every bar.
-
Feeds directly into other adaptive tools (MAMA, CG Oscillator, etc.).
Cons
-
Very thin or gappy data distort QtQ_tQt.
-
Requires ≈ 50 bars warm-up for stable output.
-
Pure phasor streams are diagnostic; they still need rule logic for entries, exits, and stops.
Summary
The Phasor Components indicator applies a discrete Hilbert transform to a detrended price series, producing two orthogonal streams:
-
In-Phase ( I ) – the real part, identical to the filtered price.
-
Quadrature ( Q ) – a 90°-shifted version of the same series.
These form the analytic signal (formula) , whose:
-
Amplitude (formula) gauges real-time cycle strength / volatility.
-
Phase angle (formula) reveals the market’s exact location inside its dominant cycle (0°≈trough, 180°≈peak).
-
Instantaneous period (formula) estimates the current wavelength.
Traders use these outputs to:
-
Time turns – long near phase-troughs, short near peaks.
-
Auto-tune look-backs – set oscillator length to ~½ Pₜ and smoothing length to Pₜ.
-
Gauge regimes – ride trends when amplitude is high; trade mean-reversion when it is low.
Handle the first ~50 bars as warm-up, ensure clean data to avoid Hilbert distortion, and pair the phasor insights with price/volume confirmation. Done right, the indicator converts static strategies into adaptive, cycle-synchronized systems that stay in phase with the market’s changing rhythm.
The Encore
The Hilbert Phasor Components turn price into a rotating vector:
(Formula — visualization pending)
Use the angle to time trades, the radius to gauge power, and the period to auto-tune any indicator window. Handle data clean-up and confirmation filters, and you’ll surf the market’s live rhythm instead of paddling behind the wave. Rock on and manage that risk!
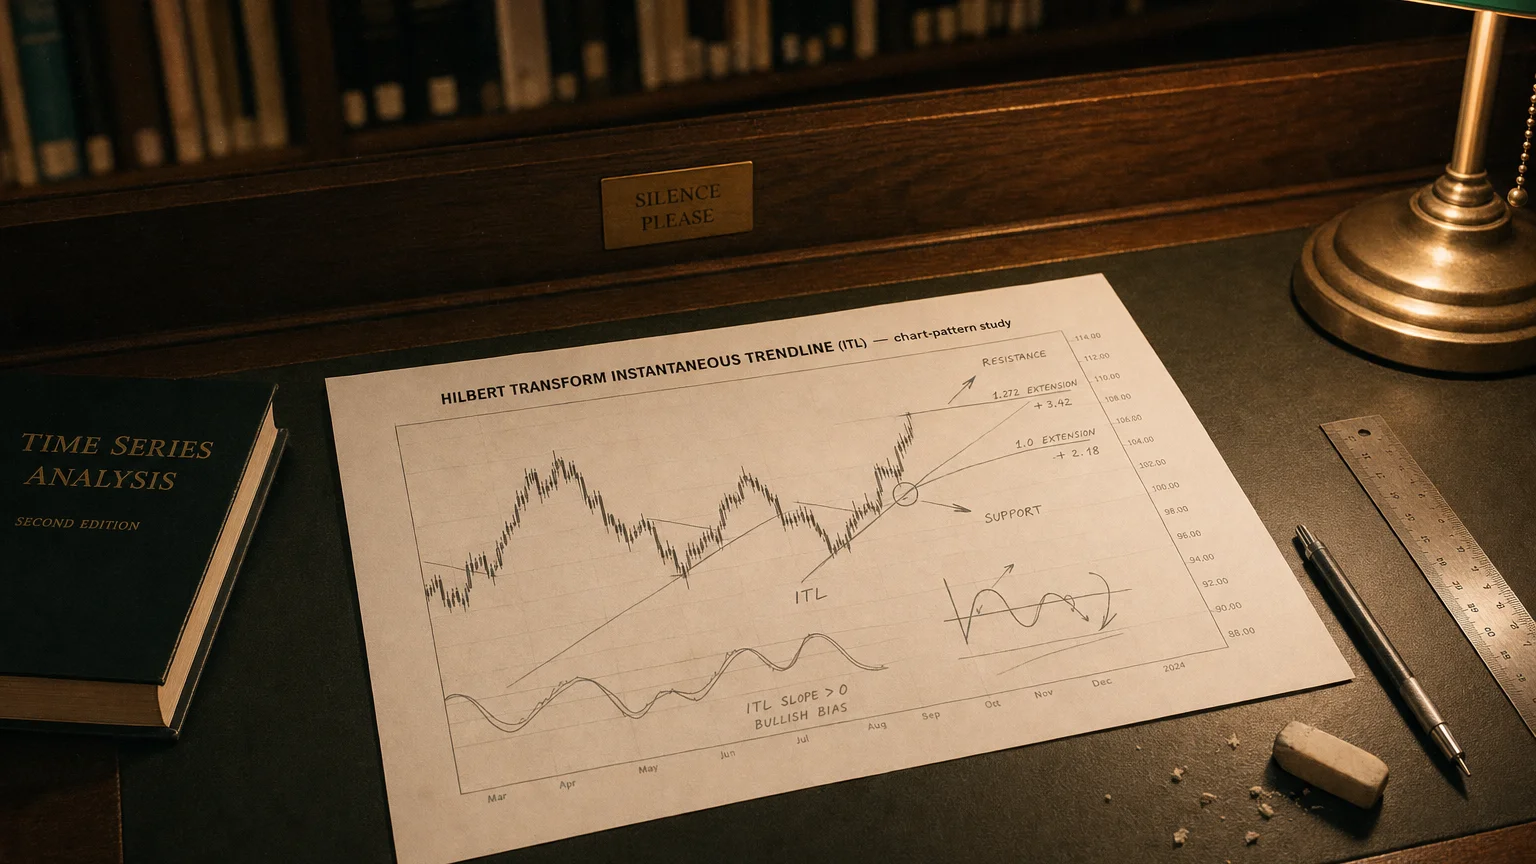
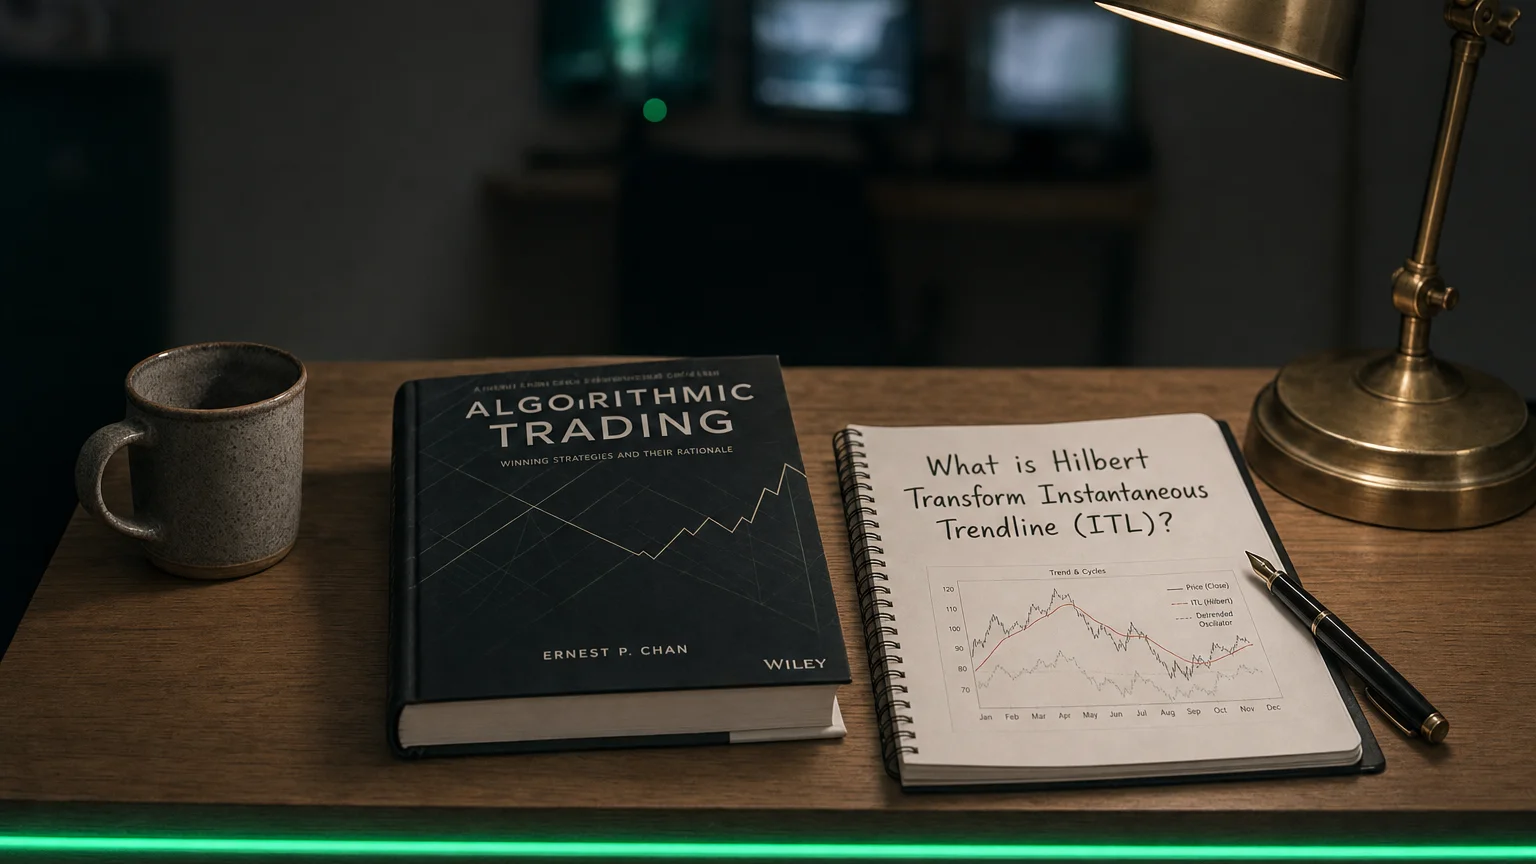
Q · 01What is Hilbert Transform Instantaneous Trendline?+