The Commodity Channel Index (CCI) is an unbounded momentum oscillator that measures how far price deviates from its n-period statistical mean. Readings above +100 signal strong bullish momentum; below −100 indicate oversold conditions. Most values fall within ±100.
There is nothing new on Wall Street or in stock speculation. What has happened in the past will happen again and again.

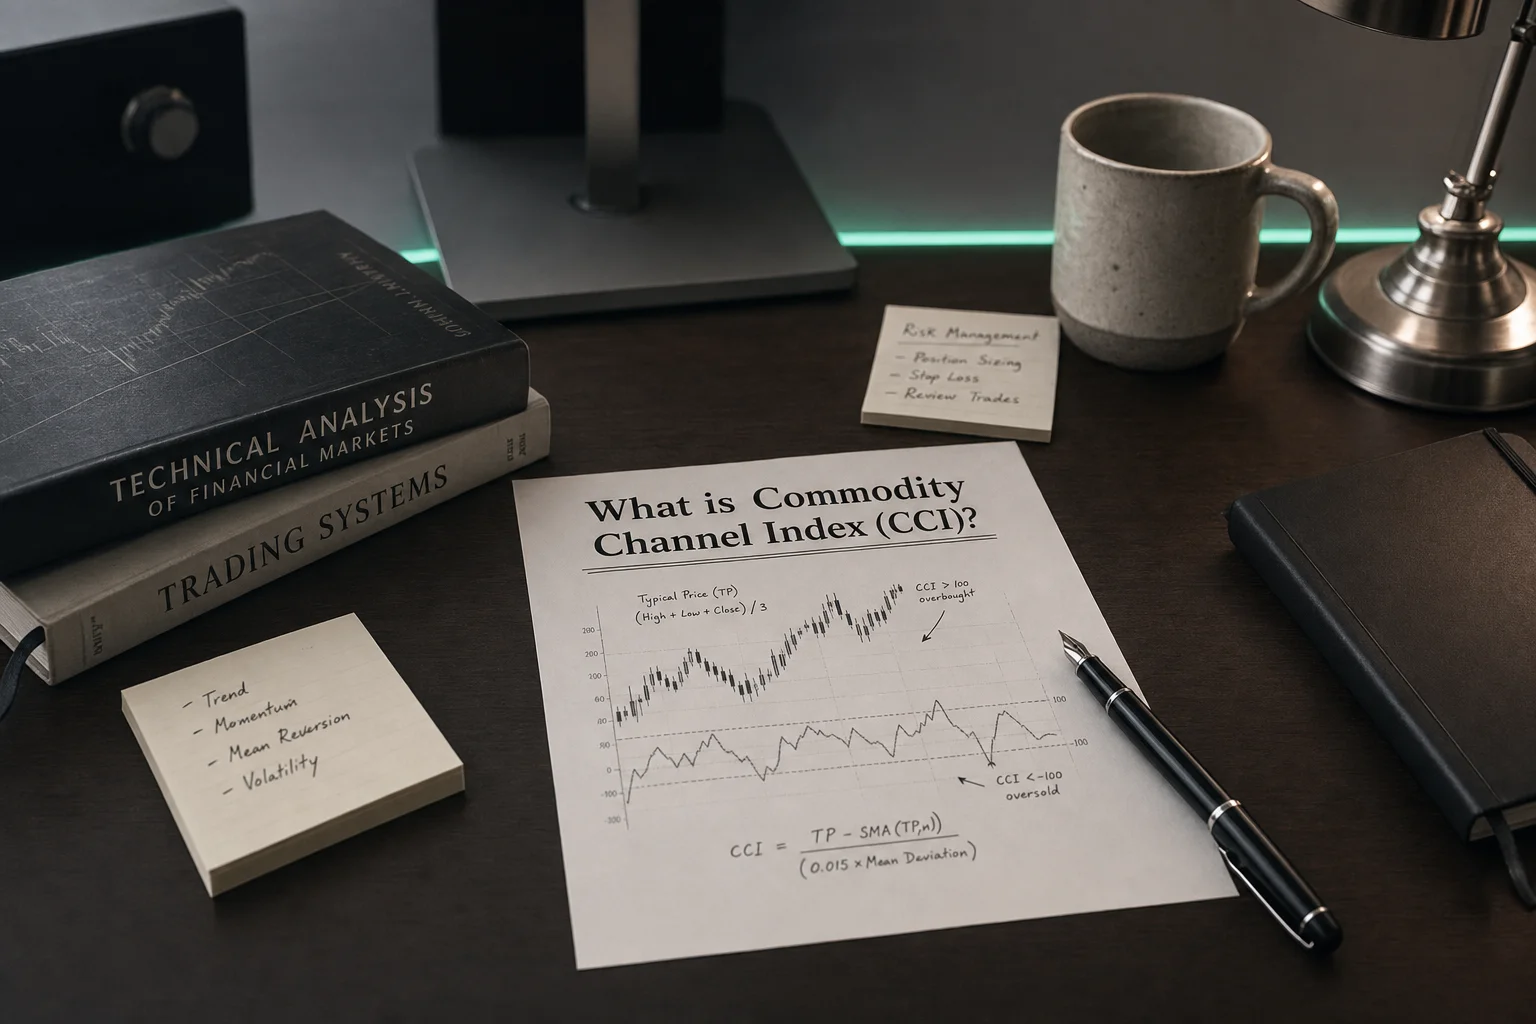
The Commodity Channel Index (CCI) is a versatile momentum-based oscillator developed by Donald Lambert in 1980. Despite its name, it is applicable to all asset classes — not just commodities. The CCI measures the deviation of price from its statistical average, helping traders identify overbought/oversold conditions, trend strength, and potential reversals.
It is especially valued for uncovering cyclical price movements and for its ability to detect shifts in market momentum ahead of price action.
Core Formula
CCI=(Typical Price−SMAn)0.015×Mean Deviation\text{CCI} = \frac{( \text{Typical Price} - \text{SMA}_{n})}{0.015 \times \text{Mean Deviation}}CCI=0.015×Mean Deviation(Typical Price−SMAn)
Where:
-
Typical Price (TP) = (High+Low+Close)/3(High + Low + Close)/3(High+Low+Close)/3
-
SMAₙ = Simple Moving Average of the Typical Price over n periods (commonly 20)
-
0.015 = Lambert’s constant to scale most values within ±100
Interpretation Guidelines
| CCI Value | Market Condition |
|---|---|
| +100 and above | Potential overbought condition / bullish strength |
| –100 and below | Potential oversold condition / bearish strength |
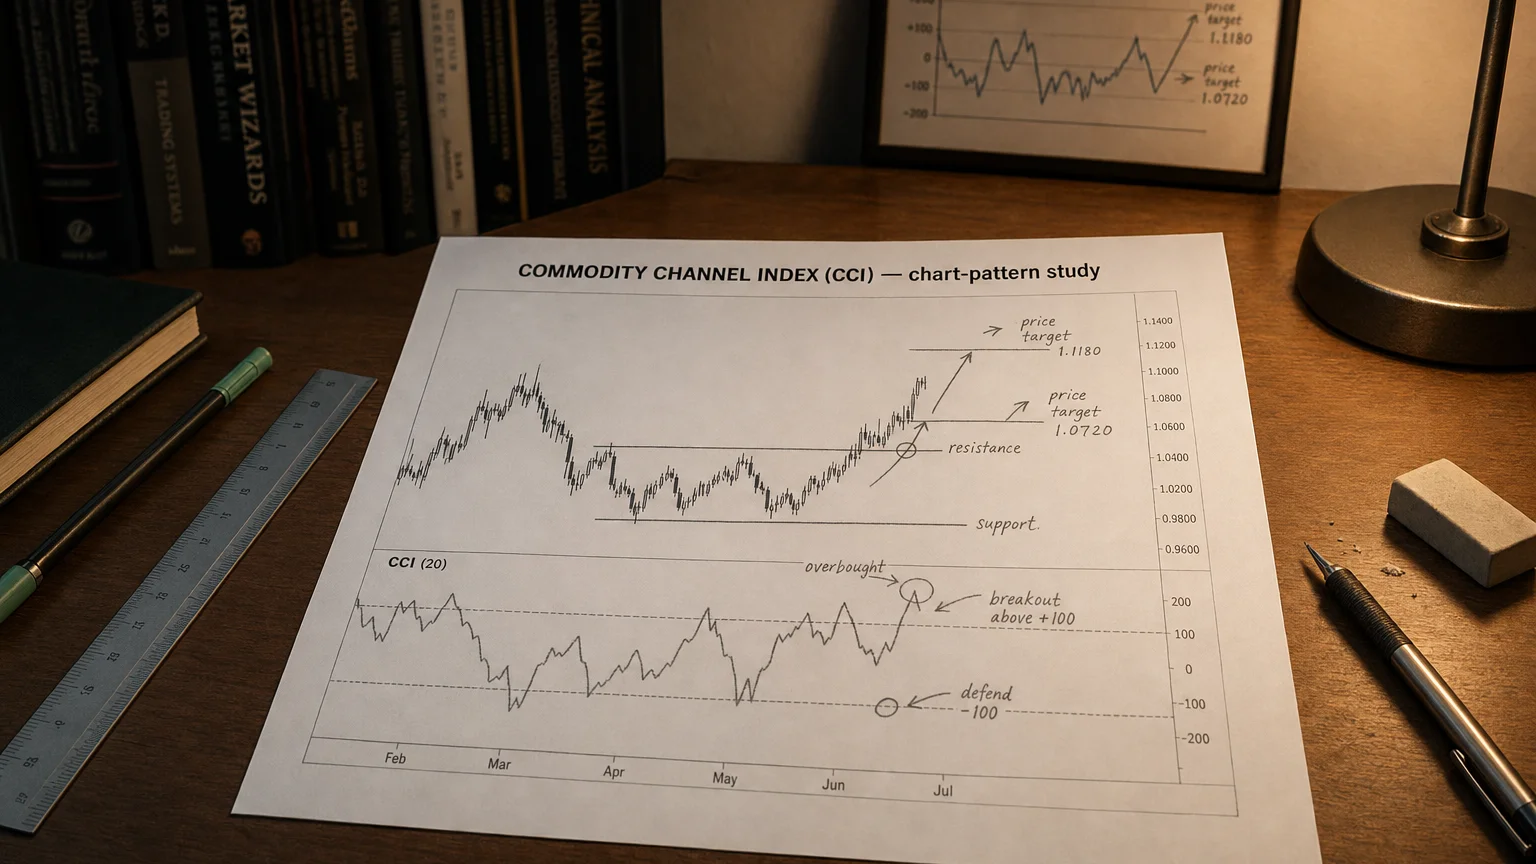
| Crossing +100 | Possible buy signal (momentum accelerating) |
| Crossing –100 | Possible sell signal (momentum weakening) |
| Between ±100 | Neutral / consolidating or preparing for a move |
-
Unlike many oscillators, the CCI is unbounded — it can exceed ±300 during strong market moves.
-
Sustained values above +100 or below –100 indicate strong trends rather than just reversal zones.
Strategic Use Cases
-
Trend Entry Signals
- Breaks above +100 or below –100 often signal the start of strong momentum moves.
-
Mean Reversion Triggers
- Reversals from extreme highs/lows are used in range-bound or countertrend strategies.
-
Divergence Detection
- Divergences between CCI and price can warn of trend exhaustion and reversal potential.
-
Multi-Timeframe Confirmation
- Used alongside long-term moving averages or volatility bands to validate trade timing.
Professional Applications
-
Swing and Position Trading: Used to isolate ideal entry and exit windows around cyclical highs and lows.
-
Systematic Models: Common input in momentum-mean reversion hybrids.
-
Multi-Asset Strategy: Works equally well in equities, forex, futures, and cryptocurrencies.
-
ETF/Portfolio Screening: Filters assets exhibiting extreme short-term momentum or volatility mispricing.
Limitations
-
False signals in choppy or sideways markets; CCI works best in cleanly trending or clearly cycling conditions.
-
Highly sensitive to short-term noise — smoothing or signal confirmation from other indicators (like RSI, MACD, or volume) is recommended.
-
Should not be relied on in isolation; best used within a multi-indicator or rules-based framework.
Summary
The Commodity Channel Index (CCI) is a powerful momentum oscillator that quantifies price deviation from the mean, providing traders and analysts with real-time insight into market strength, timing, and potential reversals. Its flexible structure makes it a key component in trend-following, mean-reverting, and multi-factor trading systems. Whether you’re managing tactical entries or building predictive analytics, CCI offers a reliable edge when deployed with discipline and context.
Q · 01What does CCI measure in technical analysis?+
Q · 02How do traders use CCI signals?+
Q · 03What period setting works best for CCI?+