A detailed guide to the Williams Percent Range (%R), a powerful momentum oscillator for identifying overbought and oversold conditions.
The most important rule of trading is to play great defense, not great offense.
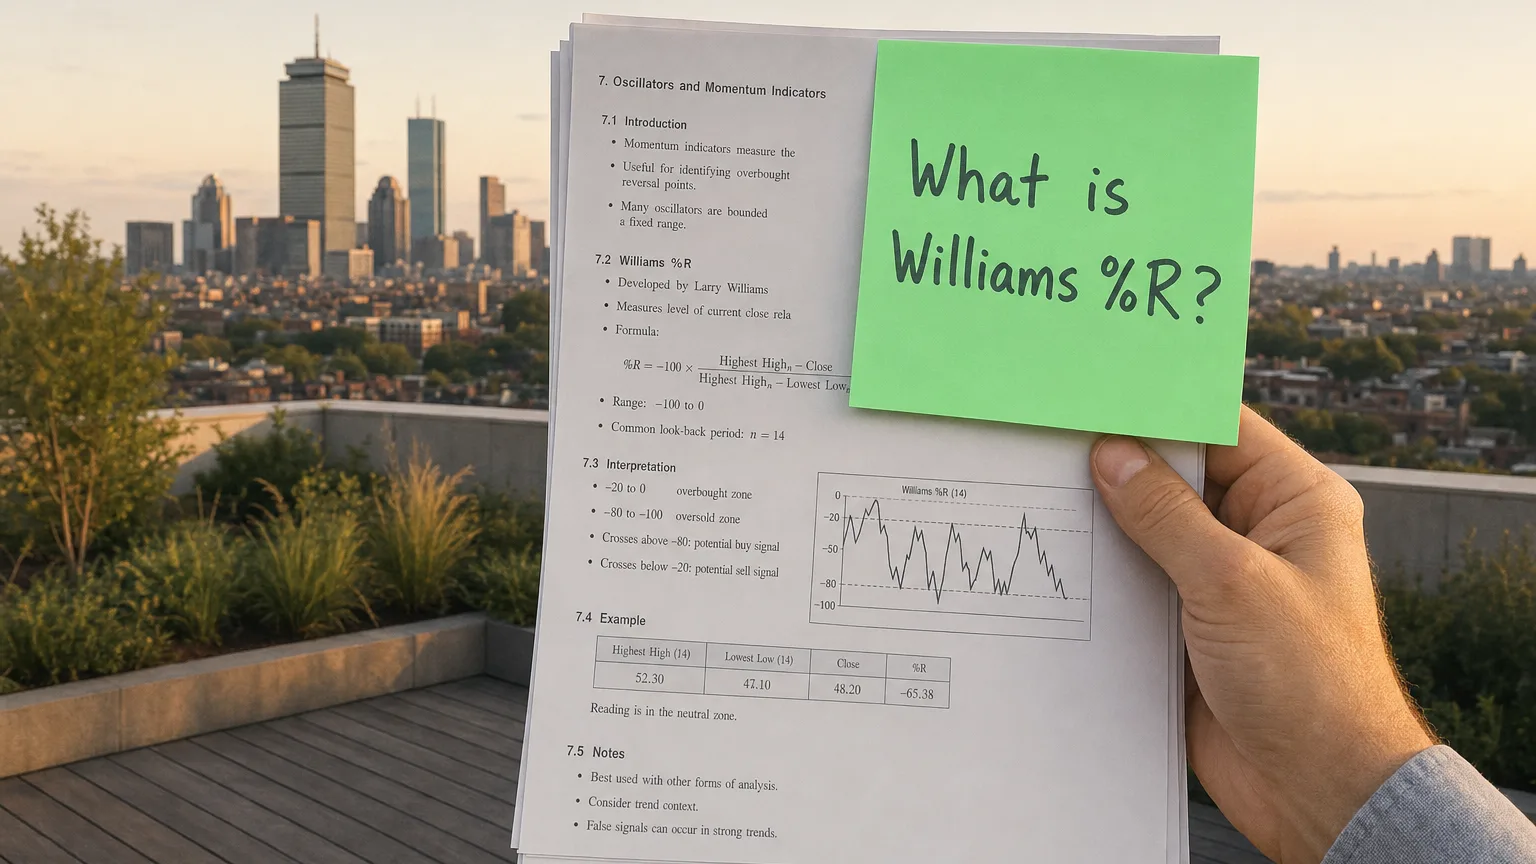
The Williams Percent Range, or simply %R, is a dynamic momentum indicator developed by the famous trader Larry Williams. It is designed to identify overbought and oversold levels in the market, making it a valuable tool for timing entries and exits. The %R oscillates between 0 and -100, providing a clear visual representation of where the current price is in relation to the highest high over a specific period. Its sensitivity and straightforward interpretation have made it a popular choice among traders for gauging market momentum and anticipating potential reversals.
What is the Williams Percent Range?
The Williams Percent Range (%R) is a momentum oscillator that measures the level of the closing price in relation to the high-low range over a specific period, typically 14 days. It is a bound oscillator, meaning its values are always between 0 and -100. The %R is designed to show the relative position of the current closing price within the recent trading range. A reading close to 0 indicates that the price is near the highest high of the period, while a reading close to -100 suggests the price is near the lowest low. This information helps traders to identify potential turning points in the market.
Unlike many other oscillators, the Williams %R is a leading indicator, meaning it can often signal a potential reversal before it occurs in the price.
The Formula and Calculation of Williams %R
The calculation of the Williams %R is straightforward and involves comparing the current closing price with the highest high and lowest low over a specified period.
Formula:
Where:
- Highest High: The highest price in the lookback period (typically 14 days).
- Lowest Low: The lowest price in the lookback period.
- Current Close: The most recent closing price.
“The most important rule of trading is to play great defense, not great offense.”
— Paul Tudor Jones, Founder, Tudor Investment Corp Market Wizards (1989)
How to Interpret and Use Williams %R
The interpretation of the Williams %R is based on its position relative to the overbought and oversold levels:
- Overbought Conditions: A reading between 0 and -20 is considered overbought. This suggests that the price is trading near the top of its recent range and may be due for a pullback or reversal to the downside.
- Oversold Conditions: A reading between -80 and -100 is considered oversold. This indicates that the price is trading near the bottom of its recent range and may be poised for a rally or reversal to the upside.
- Momentum Failure: A failure of the %R to reach the overbought or oversold levels can also be a sign of a weakening trend.
It is important to remember that an overbought or oversold reading does not guarantee a reversal. A security can remain in an overbought or oversold condition for an extended period in a strong trend. Therefore, it is best to use these signals in conjunction with other forms of analysis.
Trading Strategies with Williams %R
Overbought/Oversold Reversals
A common strategy is to look for reversal signals when the %R moves out of the overbought or oversold zones. For example, a trader might sell when the %R crosses back below the -20 level after being in the overbought zone. Conversely, a trader might buy when the %R crosses back above the -80 level after being in the oversold zone.
Divergence Trading
Divergence between the Williams %R and the price can be a powerful reversal signal. Bullish divergence occurs when the price makes a new low, but the %R makes a higher low. This suggests that the downward momentum is waning and a reversal to the upside may be imminent. Bearish divergence occurs when the price makes a new high, but the %R makes a lower high, signaling a potential reversal to the downside.
Williams %R vs. the Stochastic Oscillator
The Williams %R is very similar to the Stochastic Oscillator, and in fact, the Fast Stochastic Oscillator and the Williams %R are almost identical. The main difference is in their scaling. The Williams %R oscillates between 0 and -100, while the Stochastic Oscillator ranges from 0 to 100. Both indicators are effective at identifying overbought and oversold conditions, and the choice between them often comes down to personal preference.
The Importance of Williams %R in Technical Analysis
The Williams %R is a valuable tool for traders because of its simplicity and effectiveness. It provides a clear and easy-to-read signal of overbought and oversold conditions, which can be crucial for timing entries and exits. Its ability to generate leading signals can give traders an edge in the market, allowing them to anticipate potential reversals before they happen. When used as part of a comprehensive trading plan, the Williams %R can significantly improve a trader’s ability to navigate the markets.
Limitations of Williams %R
Despite its usefulness, the Williams %R has some limitations:
- Whipsaws in Strong Trends: In a strong uptrend or downtrend, the %R can remain in the overbought or oversold territory for extended periods, leading to premature exit signals.
- Leading Nature Can Be a Double-Edged Sword: While its leading nature is an advantage, it can also lead to false signals if not confirmed by other indicators or price action.
- Less Effective in Ranging Markets: The %R is most effective in trending markets. In a sideways or ranging market, it can generate frequent and unreliable signals.
It is crucial to use the Williams %R in the context of the overall market trend and to seek confirmation from other technical indicators before making any trading decisions.