Parabolic SAR Extended is a financial concept covered in this article. The Classic Trailblazer With Extra Smarts and Flexibility
Don't focus on making money; focus on protecting what you have.
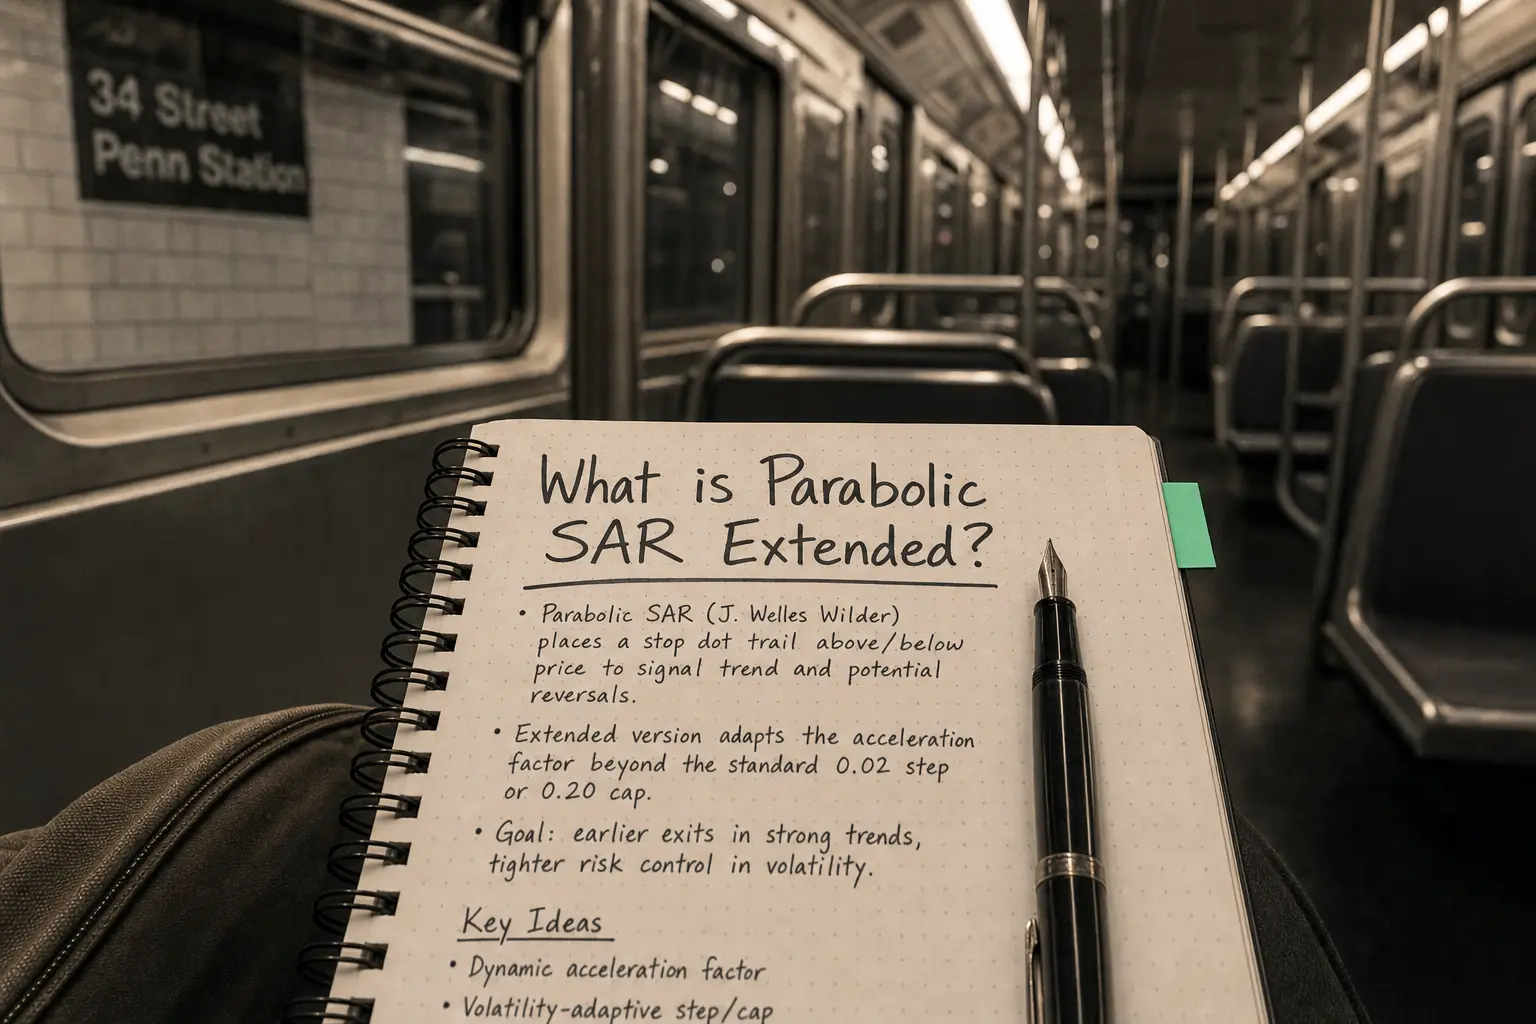
Welles Wilder’s Parabolic SAR is already a legend for trailing stops and spotting reversals, but the Extended version takes it up a notch. It keeps the core parabola magic – dots that flip sides when price reverses – while adding customizable parameters, alternative calculation modes, and often visual tweaks like color gradients or early-warning signals. Think of it as the original SAR on a tune-up: still deadly simple, but now smarter in choppy markets and more adaptable to different assets and timeframes. Perfect for traders who love SAR but want a bit more control without overcomplicating things.
Classic SAR Recap – The Foundation
Quick reminder of how standard Parabolic SAR works:
- Starts with an Acceleration Factor (AF) beginning at a step value (usually 0.02).
- AF increases by the step each time price makes a new extreme (max 0.20).
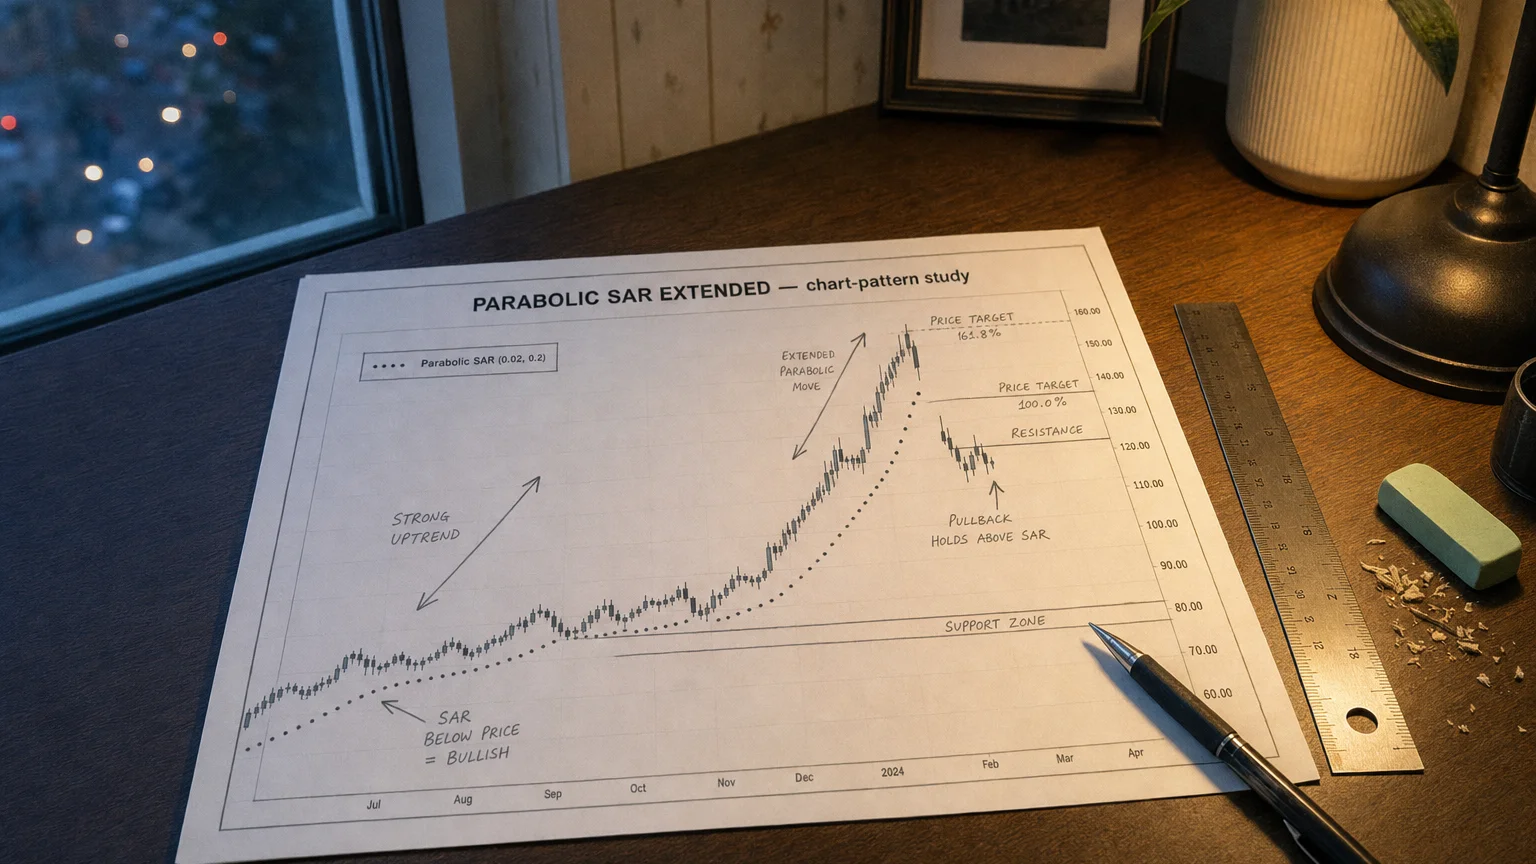
- Dots plot below price in uptrends (support), above in downtrends (resistance).
- Dot flips sides → reversal signal and new trail begins.
Extended versions keep this engine but open the hood for tweaks.
What “Extended” Usually Adds
Common upgrades you’ll find:
- Custom Start, Step, and Maximum AF – e.g., start at 0.01, step 0.01, max 0.3 for slower acceleration.
- Alternative modes – some use ATR multipliers instead of fixed AF for volatility-adjusted trailing.
- Early reversal warnings – fading dot color or secondary line before full flip.
- Visual polish – gradient colors, dot size changes, or hide dots in certain conditions.
Exact features vary by platform/script – TradingView pines often pack the most options.
“Don’t focus on making money; focus on protecting what you have.”
— Paul Tudor Jones, Founder of Tudor Investment Corporation, hedge fund manager Market Wizards: Interviews with Top Traders, Jack D. Schwager (New York Institute of Finance, 1989), chapter “Paul Tudor Jones — The Art of Aggressive Trading” (1989)
Reading the Dots – Signals Stay Intuitive
Core interpretations remain the same:
- Dots below price: Uptrend – trail stops under dots, consider longs on pullbacks to dots.
- Dots above price: Downtrend – trail stops above dots, watch for short entries.
- Dot flip: Potential reversal – classic exit/entry trigger (confirm with price action).
- Dots far from price: Strong trend accelerating – let winners run.
- Dots hugging price: Weakening trend or chop – tighten risk.
Smart Tweaks for Different Markets
Adjust the extras like this:
- Choppy/range markets: Lower start/step (0.01/0.01) and max (0.15) – slower acceleration, fewer premature flips.
- Volatile/trending assets (crypto, growth stocks): Higher step (0.03) and max (0.3–0.5) – tighter trails in big moves.
- Conservative trailing: Use ATR-based mode – dots follow volatility instead of fixed steps.
- Intraday scalping: Very low values for quick flips; daily swings prefer classic or slightly slower.
Battle-Tested Trading Setups
Proven ways to use it:
- Pure trailing stop: Enter on flip, exit on next flip – simple trend rider.
- Pullback entry: In uptrend (dots below), buy when price touches dot and bounces.
- Combo filter: Only take MACD/RSI signals in direction of current SAR position.
- Multi-timeframe: Higher-TF SAR for bias, lower-TF extended SAR for entries.
Always confirm flips with volume or candle closes – SAR can whipsaw in tight ranges.
Strengths and the Classic Pitfalls
The Wins
- Excellent trailing stop in strong trends – locks profits automatically.
- Clear visual reversal signals with dot flips.
- Extended options let you tame whipsaws or tighten trails.
- Works across all markets and timeframes.
The Gotchas
- Still whipsaws in sideways/choppy periods – no SAR variant fully solves this.
- Over-tuned parameters can curve-fit – test thoroughly.
- Lags at actual tops/bottoms – dots only flip after reversal confirmation.
Your Extended SAR Setup Checklist
- Start with classic 0.02/0.02/0.20 and tweak from there.
- Match acceleration to asset volatility and your holding horizon.
- Backtest flip accuracy and whipsaw frequency.
- Combine with trend filter (ADX > 25) or momentum confirmation.
- Use dots primarily for trailing – not standalone entries in ranges.
Q · 01What is Parabolic Sar Extended?+