True Range (TR) is a financial concept covered in this article. The Honest Measure of Daily Price Movement – Gaps Included
Money is made in Tape Reading by anticipating what is coming — not by waiting till it happens and going with the crowd.
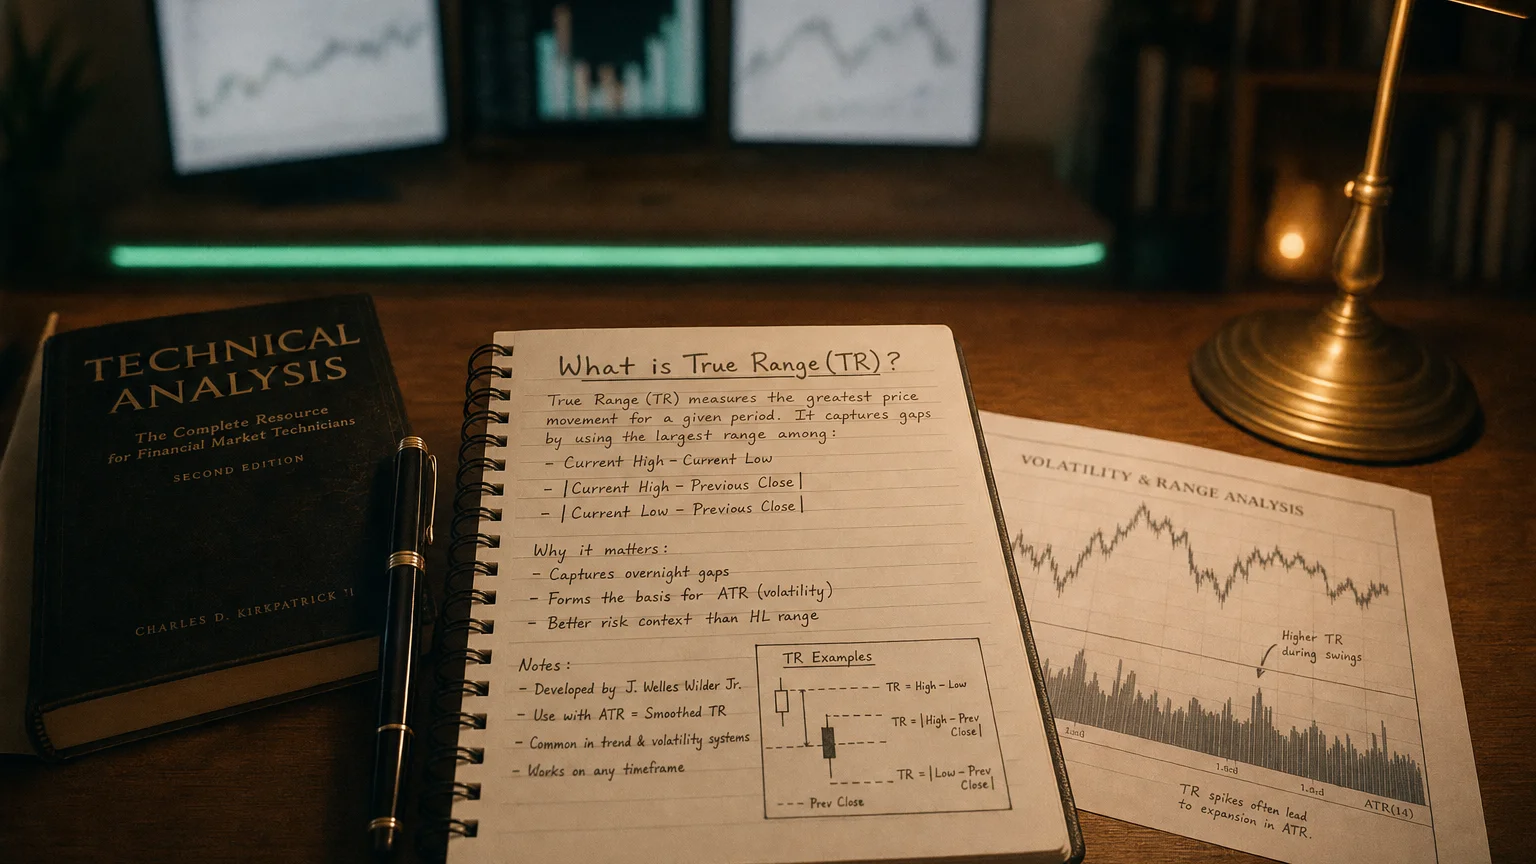
Introduced by J. Welles Wilder in his 1978 book New Concepts in Technical Trading Systems, True Range (TR) is the foundational building block for volatility indicators like ATR. Unlike a simple high-low range that ignores overnight gaps, TR captures the real distance price traveled in a session – the maximum of three possibilities: today’s range, gap up from yesterday’s close, or gap down. It’s the no-nonsense way to quantify actual volatility per bar, making it essential for realistic stops, position sizing, and understanding market ‘heat’ without getting fooled by quiet intraday action hiding big overnight moves.
The Classic True Range Formula
“Money is made in Tape Reading by anticipating what is coming — not by waiting till it happens and going with the crowd.”
— Richard D. Wyckoff, Tape reader, founder of The Magazine of Wall Street, pioneer of technical analysis Studies in Tape Reading, Ticker Publishing Company, New York, 1910 (under pseudonym Rollo Tape), p. 19 (1910)
TR is the greatest of three values:
- Current High − Current Low (today’s raw range)
- |Current High − Previous Close| (gap up potential)
- |Current Low − Previous Close| (gap down potential)
In math:
TR = \max(High - Low, |High - PrevClose|, |Low - PrevClose|)
This ensures gaps – often where real volatility hides – are fully counted.
Why True Range Matters
Key insights:
- Captures real movement: Overnight news/gaps often drive the next day’s action.
- Volatility foundation: Raw input for ATR and many stop systems.
- Better than high-low: Ignores gaps and you’d underestimate true risk.
- Universal: Works on stocks, forex, futures, crypto – anywhere with OHLC data.
Practical Ways to Use True Range
Direct applications:
- Volatility stops: Place stops at 2–3 × recent TR beyond structure.
- Position sizing: Risk fixed / (k × TR).
- Breakout filters: Only trade breakouts when recent TR expanding.
- Single-bar analysis: Big TR bar + volume = high-conviction move.
TR feeds ATR – average it for smoother volatility reads.
True Range vs Simple Range
Why TR wins:
- Simple Range: Just High − Low – misses gaps completely.
- True Range: Includes gaps – reflects actual trader experience.
- Example: Stock closes 55 open, trades 57 → simple range 7.
Strengths and Natural Limits
The Wins
- Honest volatility capture – gaps included.
- Simple, robust, no parameters (per bar).
- Foundation for ATR and advanced vol tools.
- Essential for realistic risk management.
The Limits
- Single-bar only – noisy without averaging (use ATR).
- Raw price units – not comparable across assets (normalize for that).
- No direction – just magnitude.
Your True Range Quick-Start
- Plot TR bars or line on any chart.
- Compare recent TR to historical average for context.
- Use for stops: 2–3 × TR beyond swings.
- Feed into ATR(14) for smoother volatility.
- Watch TR expansion – often precedes big moves.