Normalized Average True Range (N-ATR) is a financial concept covered in this article.
There is nothing new on Wall Street or in stock speculation. What has happened in the past will happen again and again.

Wilder’s classic Average True Range (ATR) reports volatility in raw price units (e.g., $ 3.50).
-
A $ 3.50 ATR on a $ 30 stock (≈ 12%) is wild.
-
The same $ 3.50 on a $ 1 500 stock (≈ 0.2%) is tame.
Normalized ATR rescales ATR relative to price (or another reference) so you can compare volatility across symbols, time-frames, and eras and size positions consistently.
Core Formulas
| Variant | Formula | Quick Meaning |
|---|---|---|
| ATR-%-of-Price (most common) | (Formula — visualization pending) | “Today’s average range is X % of price.” |
| ATR ÷ SMA | (formula) | Uses a smoothed divisor to mute gap noise. |
| ATR Z-Score | (formula) | Shows how many σ today’s ATR deviates from its own history. |
| ATR Ratio | (formula) | Measures current vs. baseline volatility regime. |
Default ATR length N = 14 (Wilder) but adjust per timeframe.
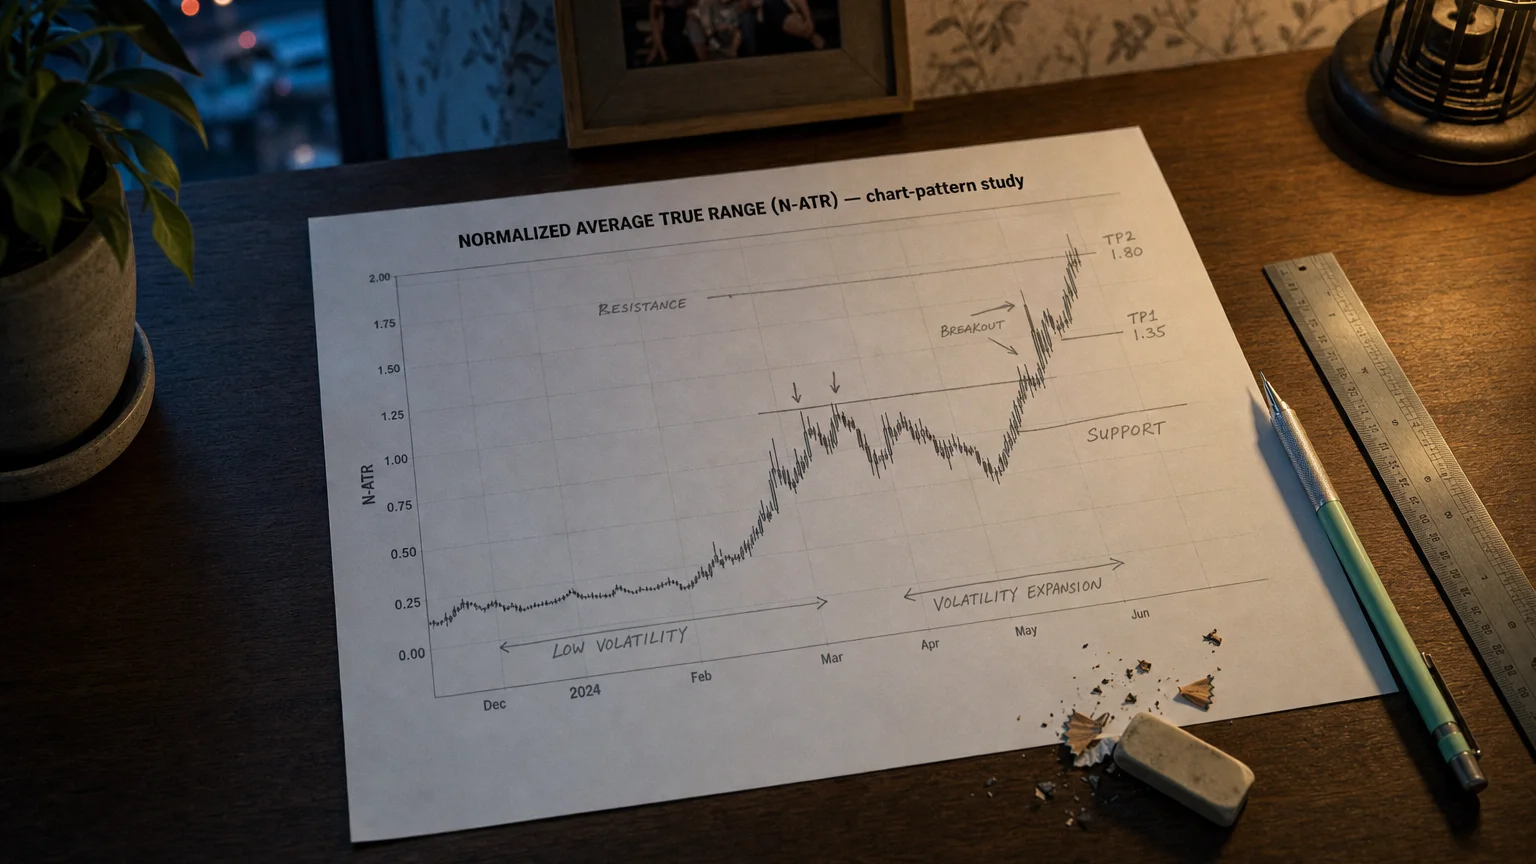
How to Read N-ATR (% of Price)
| Level (Daily) | Volatility Mood | Typical Actions |
|---|---|---|
| < 1 % | Squeeze / quiet | Anticipate breakout setups, tighten profit targets. |
| 1–2 % | Normal drift | “Business as usual”; standard sizing & stops. |
| > 3 % | Hot / expansion | Widen stops, cut size; momentum strategies shine. |
| Spike then collapse | Exhaustion → revert to mean | Fade panic moves or prep range trades. |
(Exact bands vary by asset class—back-test your own.)
4 │ Strategy Applications
A │ Consistent Position Sizing
(Formula — visualization pending)
Keeps %-account-risk steady whether a stock is at $ 20 or $ 200.
- B │ Volatility Regime Filter
-
Trade trend systems only when 14-bar N-ATR % > 1.2 % and ADX > 20.
-
Sit out during low-vol chop.
- C │ Breakout Validity Check
- Long breakout signal accepted only if N-ATR % is rising vs. prior 10 bars (volatility confirmation).
- D │ Options Pricing Gauge
-
Compare N-ATR % to Implied Vol %:
- N-ATR surging while IV lagging → IV potentially under-priced.
Parameter & Design Tweaks
| Component | What to Tweak | When / Why |
|---|---|---|
| ATR Length (N) | 7–10 for intraday; 14–21 for daily; 30+ for weekly | Shorter = faster, noisier. |
| Divisor | Close vs. SMA(N) | SMA smooths out overnight gaps. |
| Z-Score Windows | 50–100 bars for baseline | Longer = stabler mean; shorter = quicker regime flag. |
| Bands / Thresholds | 1 %, 3 % typical for equities; tweak for FX or crypto | Align with historical percentiles. |
Strengths & Caveats
| Strengths | Limitations |
|---|---|
| Puts all tickers on a common volatility scale | Still backward-looking; shock news can dwarf ATR |
| Simplifies risk & stop management | Choice of divisor affects scale; be consistent |
| Quickly flags volatility squeezes & explosions | Direction-agnostic—needs trend filter for bias |
| Easy to code in any platform | Volume not considered; pair with volume measures if needed |
Implementation Checklist
-
Compute ATR(N) with Wilder’s method.
-
Normalize via Close (or SMA). Plot as % or decimal.
-
Draw bands (e.g., 1 %, 2 %, 3 %) or percentile shading.
-
Back-test position sizing, filters, and alerts tied to N-ATR thresholds.
-
Layer with direction (trend MA, ADX, MACD) for full trade rules.
-
Monitor & retune thresholds each quarter as volatility regimes evolve.
Bottom Line
Normalized ATR turns raw range data into a universally comparable volatility dial. Whether you’re sizing positions, filtering setups, or gauging option value, N-ATR keeps your decisions anchored to relative—not absolute—price movement.
Measure the heat in percentages, trade with calibrated risk, and keep your charts rocking!
Q · 01What is Normalized Average True Range?+