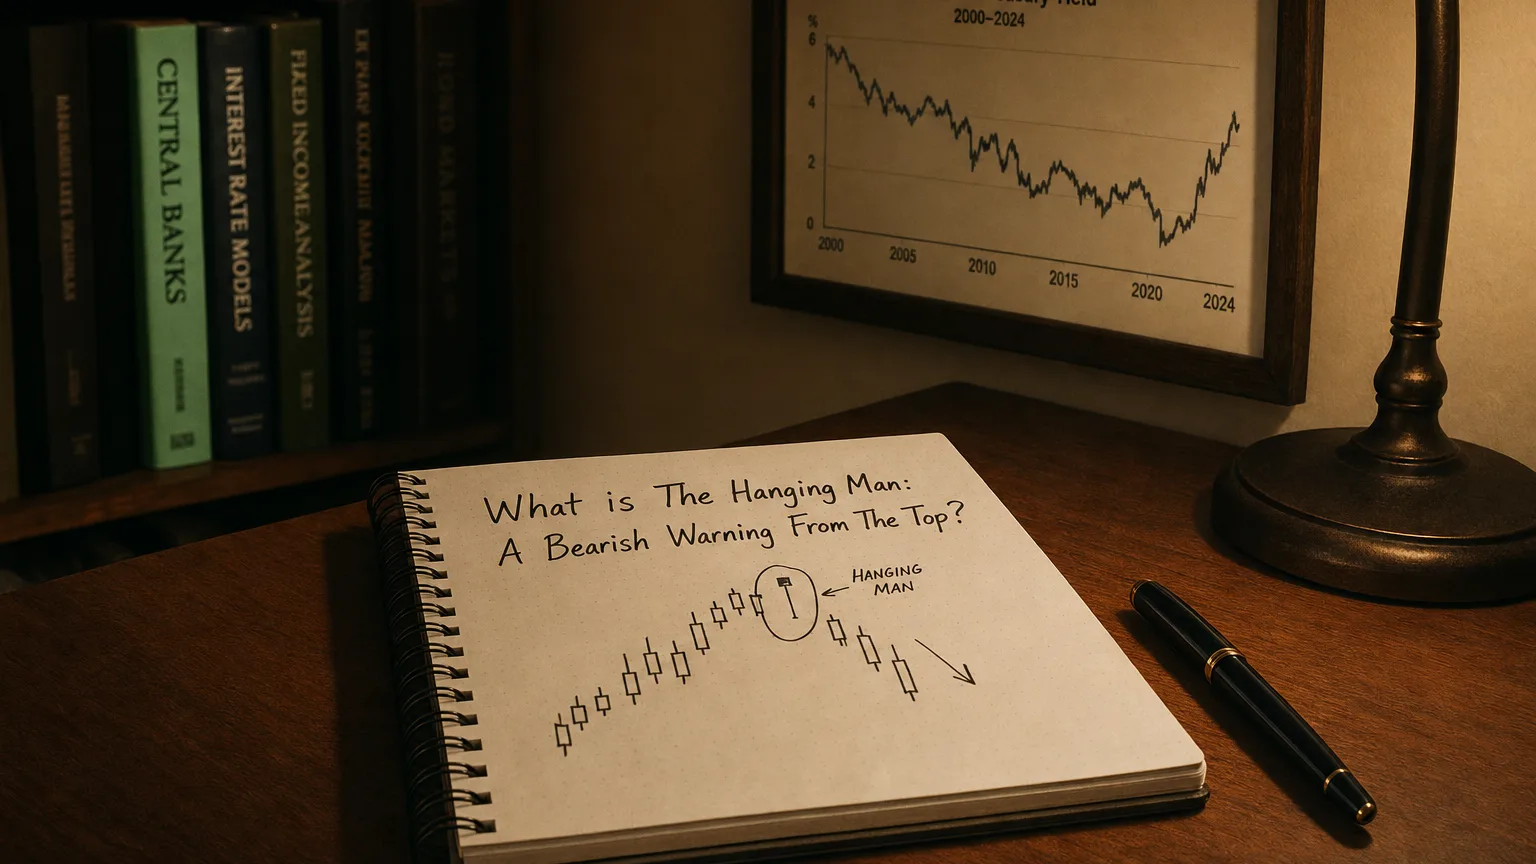
How this single-candle pattern, appearing after an uptrend, signals that the bulls might be losing their grip.
There is nothing new on Wall Street or in stock speculation. What has happened in the past will happen again and again.

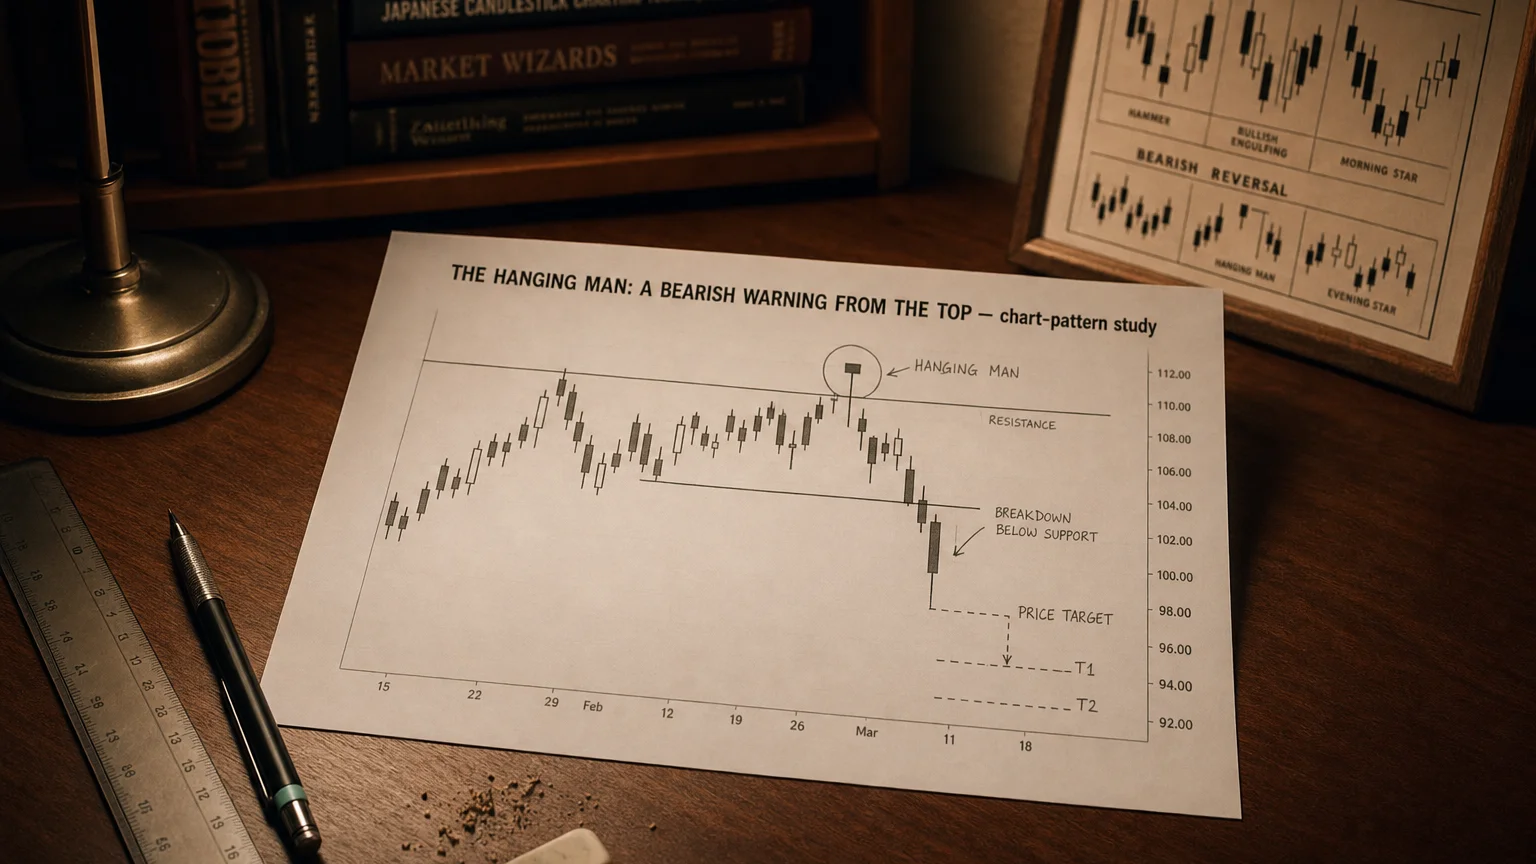
The Hanging Man is a single-bar bearish candlestick pattern that appears after an upswing and warns that the rally may be running out of altitude. Visually identical to a Hammer, it flips the psychology: in an up-trend, a long lower shadow and tiny upper-third real body reflect intraday selling pressure that buyers barely managed to claw back—often a prelude to profit-taking or outright reversal.
Construction
| Component | Requirements | Market Story |
|---|---|---|
| Lower shadow | ≥ 2 × height of real body | Sellers punched price lower during the session. |
| Real body | Small; located near the candle’s high (can be red or green) | Buyers recovered but with little conviction. |
| Upper shadow | Minimal or none | No follow-through buying above the open. |
| Prerequisite | Forms after a sustained advance, gap-up, or overbought leg | Context converts the shape into a bearish omen. |
Interpretation
-
Intraday Bear Probe – First real sign that sellers have appeared in size.
-
Weak Close Relative to Range – Bulls retake only part of the loss, hinting at fatigue.
-
Potential Top Signal – If the next candle closes lower, momentum often flips down.
Tactical Uses
| Objective | Practical Playbook |
|---|---|
| Short / Hedge Setup | Enter on a break below the Hanging Man’s low or on the next bearish candle. |
| Stop Placement | Protective stop just above the Hanging Man’s high. |
| Confirmation Filters | Combine with: • Volume spike on the Hanging Man • RSI/MACD bearish divergence • Key resistance / Fibonacci / upper Bollinger touch |
| Profit Protection | Ideal to tighten trailing stops or scale out of long positions near trend climaxes. |
Common Pitfalls
-
No Context ≈ No Signal: Mid-range or sideways-market Hanging Men are noise.
-
Confirmation Essential: A strong bearish follow-through candle is the green-light; without it, the pattern often fails.
-
Thin-Volume Prints: Illiquid markets can create look-alike tails that lack real selling pressure—always check volume and time-of-day.
Related Candles
| Variant | Trend Location | Bias |
|---|---|---|
| Hammer | After a down-move | Bullish |
| Inverted Hammer / Shooting Star | Similar psychology, different shadow orientation | Bullish (inverted hammer) / Bearish (shooting star) |
Closing Takeaways
The Hanging Man is the chart’s way of whispering, “Up here, sellers are testing the waters.” Alone, it is a yellow flag; with confirmation, it becomes a red one. Lean on:
-
Location – Must cap a meaningful advance.
-
Follow-Through – Look for a decisive lower close on the next bar.
-
Disciplined Risk – Stops above the candle; size against its range.
Use those rules and the Hanging Man turns from a mere curiosity into a sharp tool for timing exits, hedges, and strategic short entries—helping you protect gains and capitalize when momentum flips.
Summary
A Hanging Man forms at the end of an uptrend: a candle with a tiny real body near the top of its range and a long lower shadow—proof that sellers pushed prices sharply lower intraday, while buyers could only drag them back up modestly before the close. On its own, it’s a yellow light; when the next candle closes below the Hanging Man’s low, it confirms waning bullish momentum and often heralds a deeper pullback or full reversal. Traders use it to tighten stops, lock in profits, or initiate short positions, anchoring risk just above the pattern’s high and boosting conviction with volume spikes, overbought oscillators, or nearby resistance levels.
Q · 01What is The Hanging Man?+