How this rare three-candle formation warns of buyer exhaustion and an impending shift to bearish control.
There is nothing new on Wall Street or in stock speculation. What has happened in the past will happen again and again.

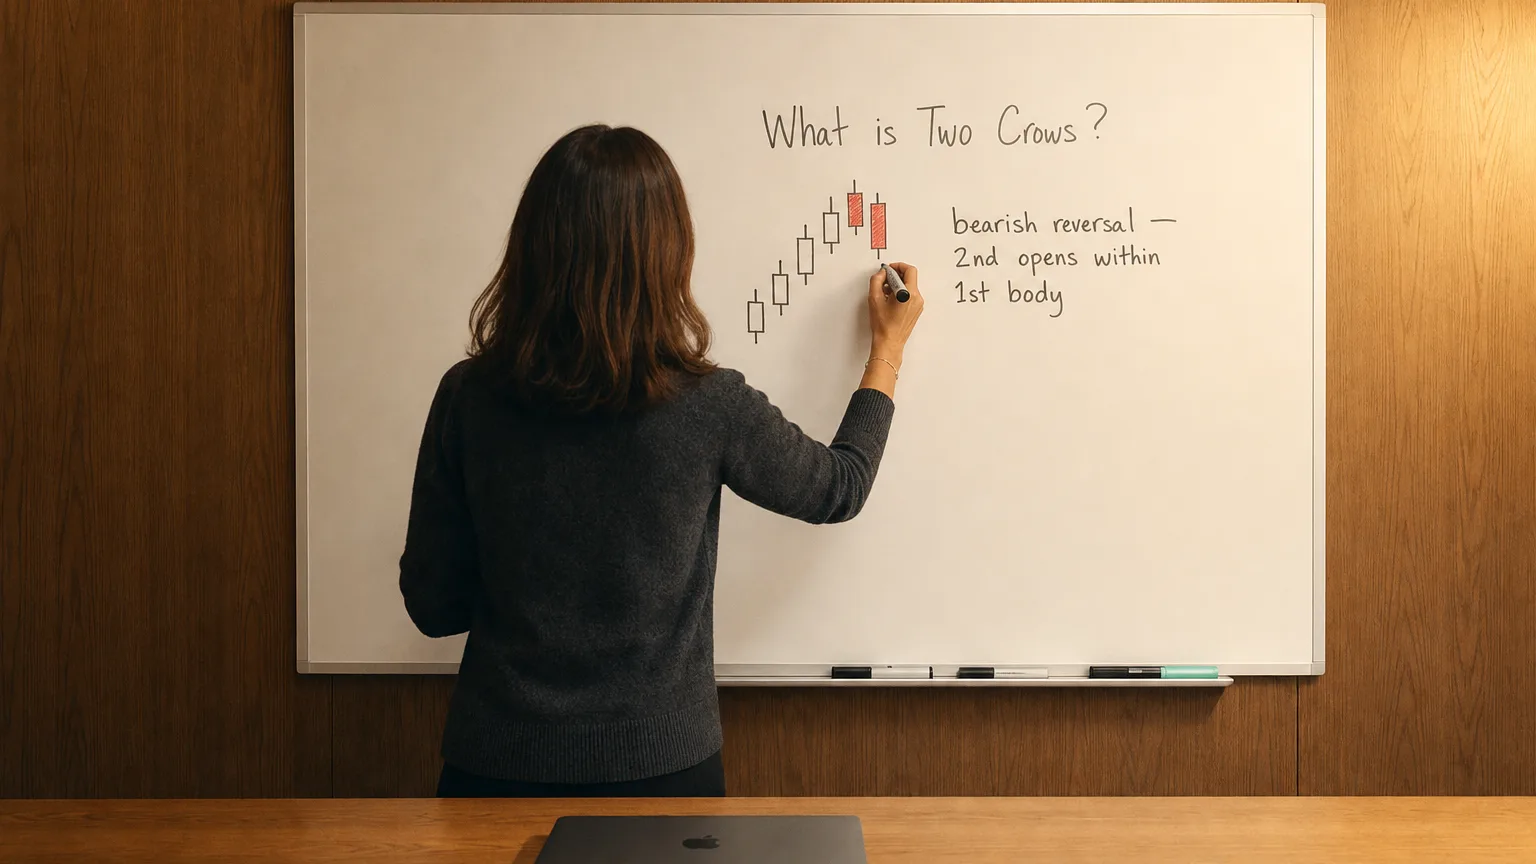
The Two Crows is a bearish reversal candlestick pattern that appears in uptrending markets and signals a potential loss of upward momentum and a trend reversal to the downside. It is relatively rare but highly significant due to its ability to identify early bearish sentiment among market participants.
Unlike single-bar indicators, the Two Crows is a three-candle formation that reflects exhaustion of buyers and the emergence of selling pressure, often before traditional trend indicators respond.
Structure of the Two Crows Pattern
The pattern consists of three consecutive candlesticks:
-
First Candle (Bullish):
- A strong upward candle, continuing the existing uptrend.
-
Second Candle (Bearish Gap-Up):
- Opens above the close of the first candle (gap up) but closes lower, creating a small bearish candle that still remains above the first candle’s close.
-
Third Candle (Bearish Engulfing):
- Opens within or slightly above the second candle’s body, then closes below the first candle’s close, signaling a clear bearish reversal.
Psychological Interpretation:
-
The market tries to push higher with a gap, but fails.
-
Bears enter aggressively on the third candle, overwhelming bulls and triggering potential liquidation or short interest.
Interpretation and Signal Logic
| Component | Interpretation |
|---|---|
| Gap-up second candle | Sign of over-enthusiastic buying |
| Bearish close on 2nd/3rd | Bears gain control and reverse the sentiment |
| Close below first candle | Confirms loss of bullish structure |
-
This pattern typically precedes a short-term trend reversal or pullback.
-
More effective when it appears near resistance, after overbought conditions, or following a strong bullish run.
Strategic Use Cases
-
Reversal Signal:
-
Used to exit long positions or initiate short positions.
-
Often integrated into candlestick-based reversal systems.
-
-
Confirmation Tool:
- Works well when paired with momentum indicators like RSI or Stochastic Oscillator to confirm overbought signals.
-
Volatility Strategy:
- Can be used to anticipate volatility expansions, where a sharp drop may follow consolidation.
-
Risk Management:
- Traders may tighten stops or reduce exposure after the pattern emerges.
Professional Applications
-
Technical Screening Models: Filters for Two Crows on daily or weekly charts to flag potential reversal setups.
-
AI/Pattern Recognition Systems: Used in training supervised models for bearish signal classification.
-
Macro Pairing: Evaluated in context with earnings, macro announcements, or sector rotations.
Limitations and Considerations
-
False signals may occur during consolidation zones or in markets with low volume.
-
Must be confirmed with price action, volume spikes, or additional indicators.
-
Not as effective in sideways markets; works best when confirming top structures.
Summary
The Two Crows candlestick pattern is a visually distinct and psychologically driven bearish reversal signal that highlights a critical shift in market sentiment from bullish to bearish. While not frequently observed, its reliability increases significantly when used in conjunction with trend analysis, volume confirmation, and momentum indicators. For traders and strategists, recognizing this pattern provides a tactical edge in protecting profits, identifying short setups, and navigating turning points in the market.