How this rare and powerful variation of the Three Black Crows pattern signals a high-conviction trend reversal.
The goal of a successful trader is to make the best trades. Money is secondary.

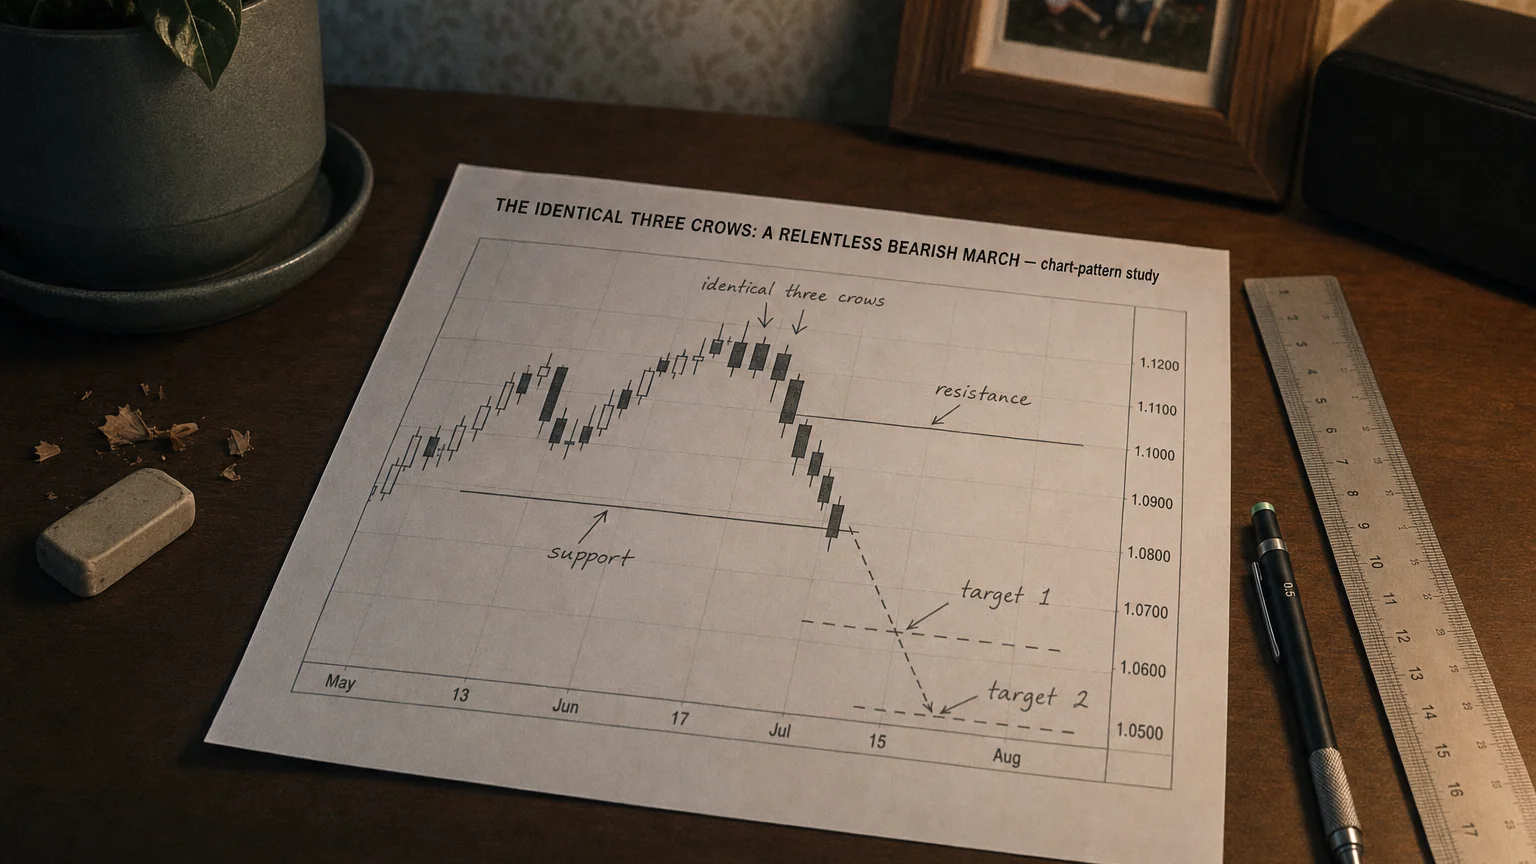
The Identical Three Crows is a bearish Japanese-candlestick formation composed of three consecutive long black (red) candles that descend step-wise after an up-move. What makes it “identical” is that each bar opens at, or within a tick of, the prior bar’s close, giving the pattern a stair-step look with almost no upside gaps. Traditional technicians treat it as a high-conviction bearish-reversal signal; modern quants note it is rare but can foreshadow powerful mean-reversion drops when confirmed.
Identification checklist
| Rule | Detail | Reason |
|---|---|---|
| Prevailing trend | Clear uptrend or strong rally into the pattern | Reversal, not continuation |
| Candle #1 | Long bearish body closing near the low | Shows sellers finally seize control |
| Candle #2 | Opens ≈ Candle #1 close, closes lower with similar range | Confirms sellers pressing without relief |
| Candle #3 | Opens ≈ Candle #2 close, closes even lower | Completes stair-step; momentum firmly bearish |
| Shadows | Ideally small/absent | Emphasises persistent selling pressure |
| Volume (filter) | Rising or above average adds credibility | Indicates institutional distribution |
Some discretionary traders require the pattern’s total height to engulf at least the last 5–10 bars to rule out “noise.”
Market psychology
-
Candle #1 – hand-off: bulls lose the bid after an extended run; profit-takers hit the tape.
-
Candle #2 – follow-through: a gap-less open signals no relief rally; fresh shorts pile on.
-
Candle #3 – capitulation: sellers press again and longs capitulate, flipping sentiment from greed to fear. The identical opens reinforce the idea of relentless supply at the prior close, choking any bounce attempt.
Trading approach
| Element | Typical tactic |
|---|---|
| Entry | Aggressive: sell at/near Candle #3 close. Conservative: sell on a break below Candle #3 low or after first bearish close that pierces that low. |
| Initial stop | Above the pattern’s high or above the midpoint of Candle #1. |
| Targets | Nearest demand zone, rising trendline, or 1.5–3 × risk. |
| Confirmation filters | - Rising volume on candles 2–3 - Bearish momentum divergence (e.g., RSI crossing below 50) - Break of short-term moving average (e.g., 20-EMA). |
If price fails to extend lower within 3–5 bars, many traders tighten stops or exit, as lingering around the pattern’s low increases fake-out risk.
Statistical tendencies
| Study | Sample size | Breakout direction | 1-month expectancy* |
|---|---|---|---|
| Bulkowski (US stocks, D1 1991-2024) | 921 occurrences | Downward 69 % | –0.9 % vs SPX baseline +0.6 % |
| AnalyzingAlpha back-test (S&P 500, Forex H4) | 1 198 occurrences | Downward ≈50 % but mean-reversion edge when shorted at next bar close | +0.21 R (5-bar hold) |
*Expectancy expressed as average R-multiple or % return versus holding index constituent. Results vary sharply by market regime and confirmation rules; rarity makes long-term stats less stable than for common patterns.
Strengths
-
Visually obvious, rules are codable for scanners.
-
Opens clustered at prior closes allow tight stops and attractive reward-to-risk.
-
When it appears after low-volatility climbs, often marks the first decisive bear hand-off.
Limitations & pitfalls
-
Extremely rare (<0.05 % of all candles in Bulkowski sample); be skeptical of small-sample stats.
-
Loses edge in high-beta news events (earnings, macro releases) where gaps distort opens.
-
Easily confused with standard Three Black Crows; ensure opens are nearly identical to prior closes to avoid false labels.
Quick visual checklist
-
Prior uptrend
- Three long black candles
-
Each opens ≈ prior close
-
Lower closes each day
Summary
The Identical Three Crows functions as a high-impact, low-frequency warning that bulls have exhausted control and bears are pressing without respite. Its best use is as a timing trigger layered onto broader reversal evidence—divergences, broken support, rising distribution volume—so you can lean into fresh downside momentum with strictly-defined risk. Trade it patiently, confirm it rigorously, and let the crows herald the market’s darker turn.
Q · 01What is The Identical Three Crows?+