This classic three-candle pattern acts as a powerful signal that the bears are losing steam and a bullish reversal may be on the horizon.
There is nothing new on Wall Street or in stock speculation. What has happened in the past will happen again and again.

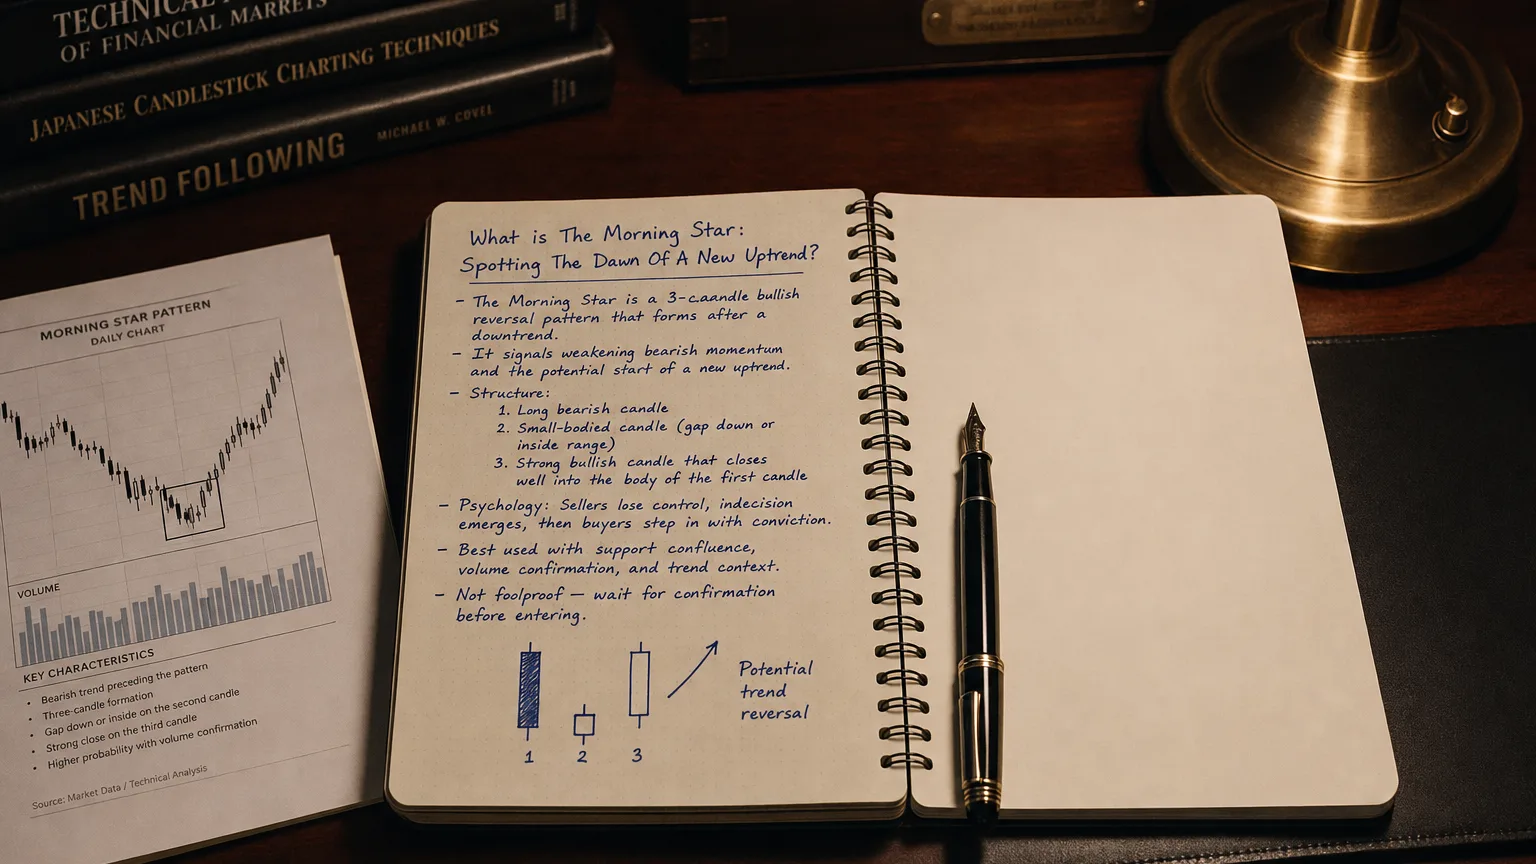
The Morning Star is a classic three-candle bullish-reversal pattern that appears after a down-trend. It opens with a long bearish candle, is “interrupted” by a gap-down indecision candle (often a doji or spinning-top), and finishes with a strong gap-up bullish candle that closes well into – or beyond – the first candle’s body. Traders read it as the market’s first “sunrise” after a bearish night, hinting that control is shifting from sellers to buyers.
Anatomy – 3-step checklist
| Step | Price action | Bullish clues |
|---|---|---|
| Candle 1 | Long red/black body closing at a fresh low | Bears still in charge |
| Candle 2 – Star | Small-bodied candle that gaps below Candle 1’s close; may be doji/spinning-top | Volatility spike + indecision |
| Candle 3 | Long green/white body that gaps up and closes ≥ 50 % into Candle 1’s body (ideal: above its midpoint) | Bulls seize control & trap shorts |
The stricter Morning Doji Star variant insists Candle 2 be a true doji; reliability rises slightly but frequency falls.
Market psychology
-
Capitulation: after sustained selling, Candle 1 extends the slide, emboldening bears.
-
Stalemate: the gap-down star shows sellers can’t push lower; bargain hunters test bids, uncertainty spikes.
-
Sentiment flip: bulls open Candle 3 above the star, drive price strongly upward, and shorts cover – igniting the first leg of a potential trend reversal.
Trading blueprint
| Element | Aggressive | Conservative |
|---|---|---|
| Entry | Buy at / just after Candle 3 close if volume ≥ 1.2 × avg. | Buy only after a close above Candle 3 high. |
| Stop-loss | Under the star’s low (or 1 × ATR). | Same. |
| Targets | 1.5–3 R or first resistance / 20-EMA. | Same; trail stop once +1 R. |
| Filters that lift edge | Oversold RSI divergence, major support zone, rising volume on Candle 3. | Ditto. |
If price doesn’t travel ≥ 0.5 R within 3–5 bars, probability of follow-through drops sharply – consider reducing exposure.
Statistical tendencies
| Source | Sample size | Bullish reversal rate | Notes |
|---|---|---|---|
| Bulkowski (US stocks) | 4 700 k candles | 78 % – 6ᵗʰ most reliable reversal (of 103) | Strong, but pattern is rare. |
| Academic study (Park & Irwin) | 40 patterns | ≈ 65 % success forecasting up-moves | Reliability rises in high-volume names. |
Edge improves further when Candle 3 closes above Candle 1’s midpoint and volume surges.
Strengths
-
High reliability compared with many reversal setups.
-
Tight, logical risk point (below star low).
-
Visually distinctive – easy to scan or code.
Limitations & pitfalls
-
Scarce – patience required on liquid symbols.
-
Smaller Candle 3 or light volume often yields failed bounces.
-
Susceptible to news gaps that can negate the signal overnight.
Quick visual cue
-
⬇ Down-trend
-
🟥 Long red candle
-
↙ gap-down
-
✝ Small doji / spinning-top
-
↗ gap-up
-
🟩 Long green candle closes > ½ red body
-
Entry → break of green high | Stop → under doji low
Summary
The Morning Star is a potent, three-act story of capitulation, hesitation, and bullish awakening. Wait for the strong third-bar close (plus volume or momentum confirmation), anchor your stop beneath the star’s low, and target at least 1.5 R so the occasional whipsaw doesn’t sting. Used with discipline and context, this sunrise pattern can illuminate high-probability turns while keeping risk on a short leash. Rock on – and trade smart!