
Adjusted geography segment data is a company's regional revenue breakdown after removing FX effects, acquisition distortions, and reclassifications — so investors can compare true operating performance across periods and peers.
The stock market is a device for transferring money from the impatient to the patient.

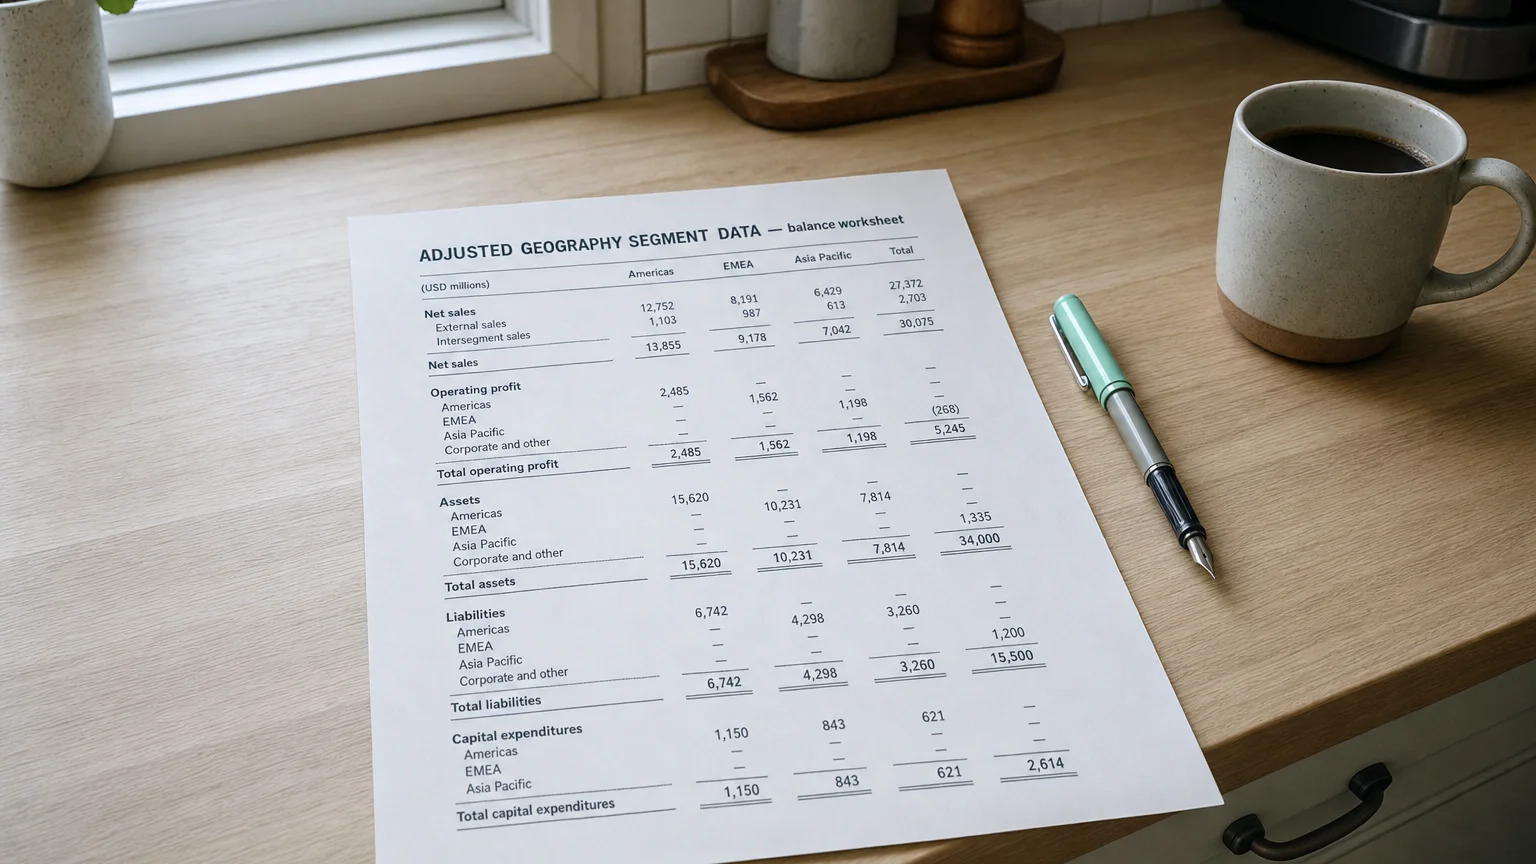
Adjusted Geography Segment Data refers to a company’s revenue (and sometimes other metrics) broken down by geographic region after applying consistent adjustments, restatements, or normalizations. These adjustments ensure comparability across periods or with peers by removing one-off effects, reclassifying regions, or aligning with a standard definition of ‘domestic’ vs. ‘international’. It gives a cleaner view of true underlying geographic performance.
Why Adjustments Are Needed
Reported geographic data can be messy. Currency swings make foreign revenue look bigger or smaller year-to-year even if volume is flat. Acquisitions add new regions mid-year. Companies sometimes shuffle countries between segments.
Adjusted data smooths these out so you can see real operational trends—like whether Europe is actually growing or just riding a weak dollar.
Common Types of Adjustments
- Constant currency (FX-neutral): Restate prior year at current rates
- Pro forma: Include acquisitions as if owned full prior period
- Organic: Exclude acquisitions/divestitures and FX effects
- Region reclassification: Consistent grouping (e.g., always put Russia in Europe)
- Transfer pricing or allocation fixes for better economic reality
Analysts love constant-currency growth—it shows volume and pricing power without currency noise.
“The stock market is a device for transferring money from the impatient to the patient.”
— Warren Buffett, Chairman & CEO, Berkshire Hathaway Berkshire Hathaway Annual Report (1999)
A Practical Example
TechCo reports:
- 2024 Europe revenue: €1,000M
- 2023 Europe revenue: €900M → +11% reported growth
- But euro weakened 15% vs. USD
Adjusted view: Restate 2023 at 2024 rates → €1,035M equivalent.
The adjusted data reveals the real story hidden by FX.
Where You Find It
- Company earnings releases (non-GAAP tables)
- Investor presentations (constant-currency slides)
- Analyst reports and models
- Supplemental geographic schedules
- MD&A discussion of FX impact
Companies increasingly provide constant-currency numbers voluntarily.
Key Insights It Provides
- True regional operational performance
- Volume/pricing trends without currency distortion
- Acquisition contribution vs. organic growth
- Market share shifts in local terms
- Exposure to specific economies
Limitations to Keep in Mind
- Non-GAAP → definitions vary by company
- Not audited
- Can be selectively presented
- Still subject to management judgment on adjustments
Always reconcile adjusted back to reported figures.
Q · 01What does constant-currency adjustment mean in segment data?+
Q · 02How does pro forma adjustment affect geographic revenue?+
Q · 03Why do companies reclassify geographic segments?+
Q · 04Where can investors find adjusted geography segment data?+
Q · 05What are the main limitations of adjusted geography data?+