
Revenue Estimates is a financial concept covered in this article. How Analysts Predict a Company's Sales and Why It's Crucial for Valuation
In the short run, the market is a voting machine. In the long run, it is a weighing machine.

While earnings estimates grab the headlines, the Revenue Estimate is arguably the more fundamental forecast. It represents an analyst’s prediction of a company’s total sales (the ‘top line’ of the income statement) for a future period. Think of it this way: revenue is the engine of a business, while profit is the horsepower it produces. An engine can be tuned for more horsepower (higher profit margins), but if the engine itself isn’t growing (revenue growth), the car isn’t going anywhere fast. That’s why seasoned investors pay just as much, if not more, attention to revenue estimates. They provide a pure, unfiltered view of a company’s growth trajectory and market demand.
The Art of the Forecast: How Are Revenue Estimates Built?
Forecasting a company’s future sales is a blend of bottom-up and top-down analysis. Analysts act like investigative journalists, piecing together clues from the company, its industry, and the economy as a whole.
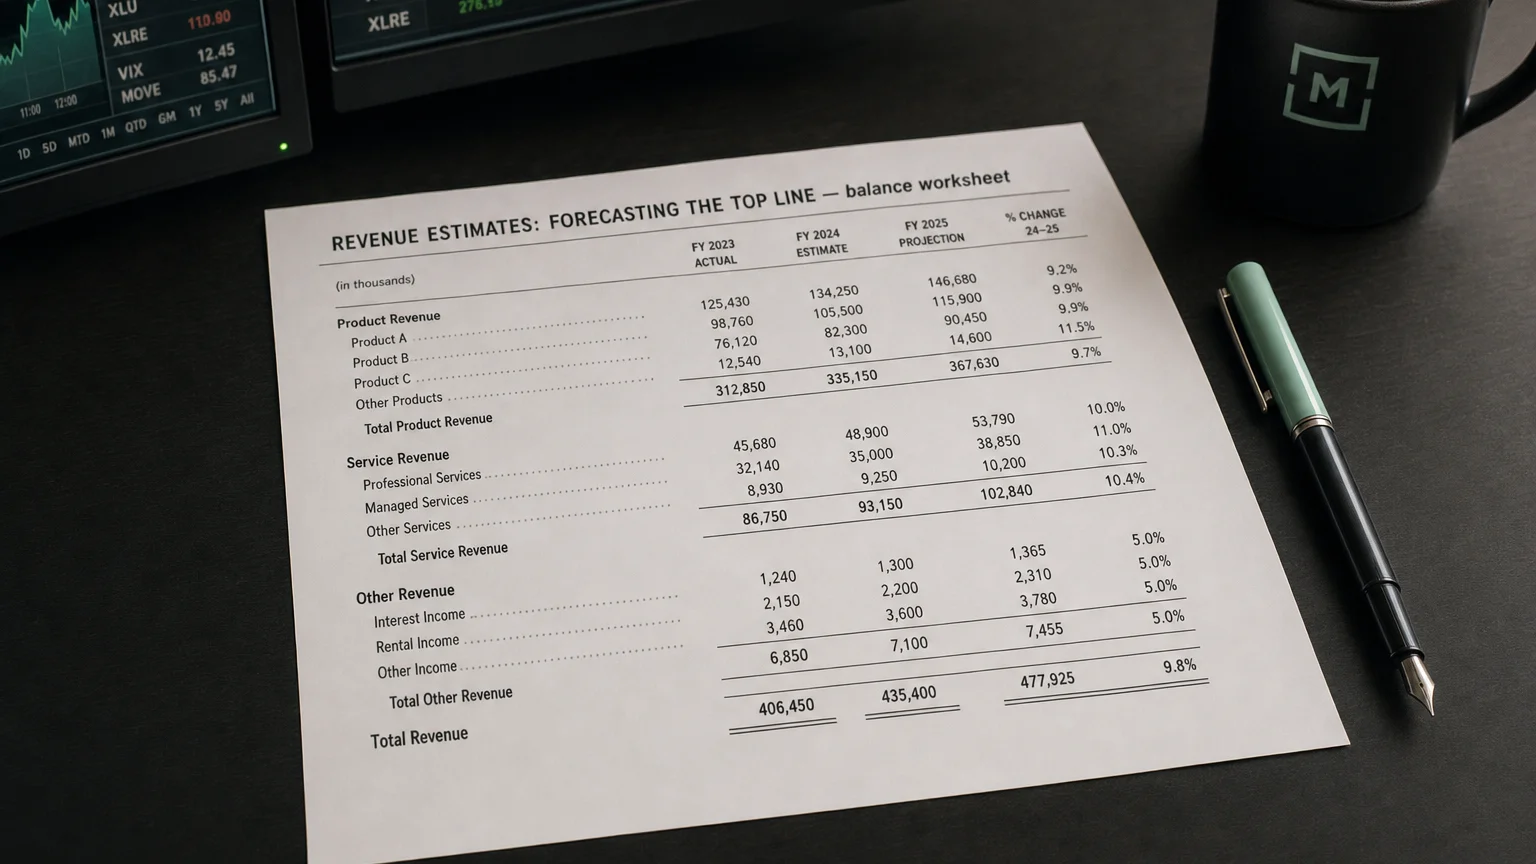
The Analyst’s Modeling Process
- Top-Down Analysis: Analysts start with the big picture. How fast is the overall economy (GDP) growing? How fast is the specific industry growing? What is the company’s market share within that industry? They use this to create a high-level sales projection.
- Bottom-Up Analysis: This is the detailed work. For a company like Apple, an analyst would build a model to forecast iPhone sales, Mac sales, and Services revenue separately, based on new product cycles, pricing, and consumer trends. They then add these segments up to get a total revenue estimate.
- Company Guidance: Just like with earnings, the company’s own management provides a revenue forecast. This is the most important input and the baseline for all analyst models.
- Qualitative Factors: Analysts also factor in qualitative information like the strength of the brand, new product pipelines, and the competitive landscape.
“In the short run, the market is a voting machine. In the long run, it is a weighing machine.”
— Benjamin Graham, Author, The Intelligent Investor Security Analysis (1934)
Why Revenue Estimates Are a Critical Piece of the Puzzle
In the world of investing, growth is king. Revenue estimates are the primary tool that Wall Street uses to quantify and track a company’s growth story.
Revenue ‘Beats’ and ‘Misses’
Just like with earnings, the market judges a company’s reported revenue against the consensus revenue estimate (the average of all analyst forecasts). A ‘revenue beat’ (reporting higher sales than expected) is a strong bullish signal that shows the company’s products or services are in high demand. A ‘revenue miss’ can be a major red flag, often punished more severely than an earnings miss, because it suggests a fundamental problem with the company’s core business.
Q: Can a company beat earnings but miss on revenue?
Yes, absolutely. This is a critical scenario to watch for. It often means the company achieved its profit target through aggressive cost-cutting (like layoffs or reduced R&D), not through healthy sales growth. The market often views this as a ‘low-quality’ beat and the stock may still fall, as cost-cutting is not a sustainable long-term growth strategy.
How to Use Revenue Estimates in Your Analysis
Smart investors use revenue estimates as a lens to focus on a company’s growth trajectory and market position. It’s about understanding the health of the business engine.
A Practical Investor’s Workflow
- Prioritize the Top Line: During earnings season, look at the revenue number first. Did the company beat, meet, or miss the consensus estimate? This gives you an instant read on its market momentum.
- Analyze the Growth Rate: Don’t just look at the absolute number. Compare the revenue to the same quarter last year. Is the year-over-year revenue growth accelerating or decelerating? For growth stocks, an accelerating growth rate is a key bullish indicator.
- Track Estimate Revisions: Just like with EPS, the trend of revenue estimate revisions is a powerful tool. Are analysts consistently raising their sales forecasts for the upcoming quarters? This suggests the business has strong underlying momentum.
- Compare to Competitors: How does the company’s estimated revenue growth stack up against its main competitors? A company that is growing its sales at 20% in an industry that is only growing at 5% is clearly gaining market share, which is a very strong sign.
Q · 01What is Revenue Estimates?+