How this two-candle reversal pattern signals that a trend's momentum is stalling and a major shift could be imminent.
There is nothing new on Wall Street or in stock speculation. What has happened in the past will happen again and again.

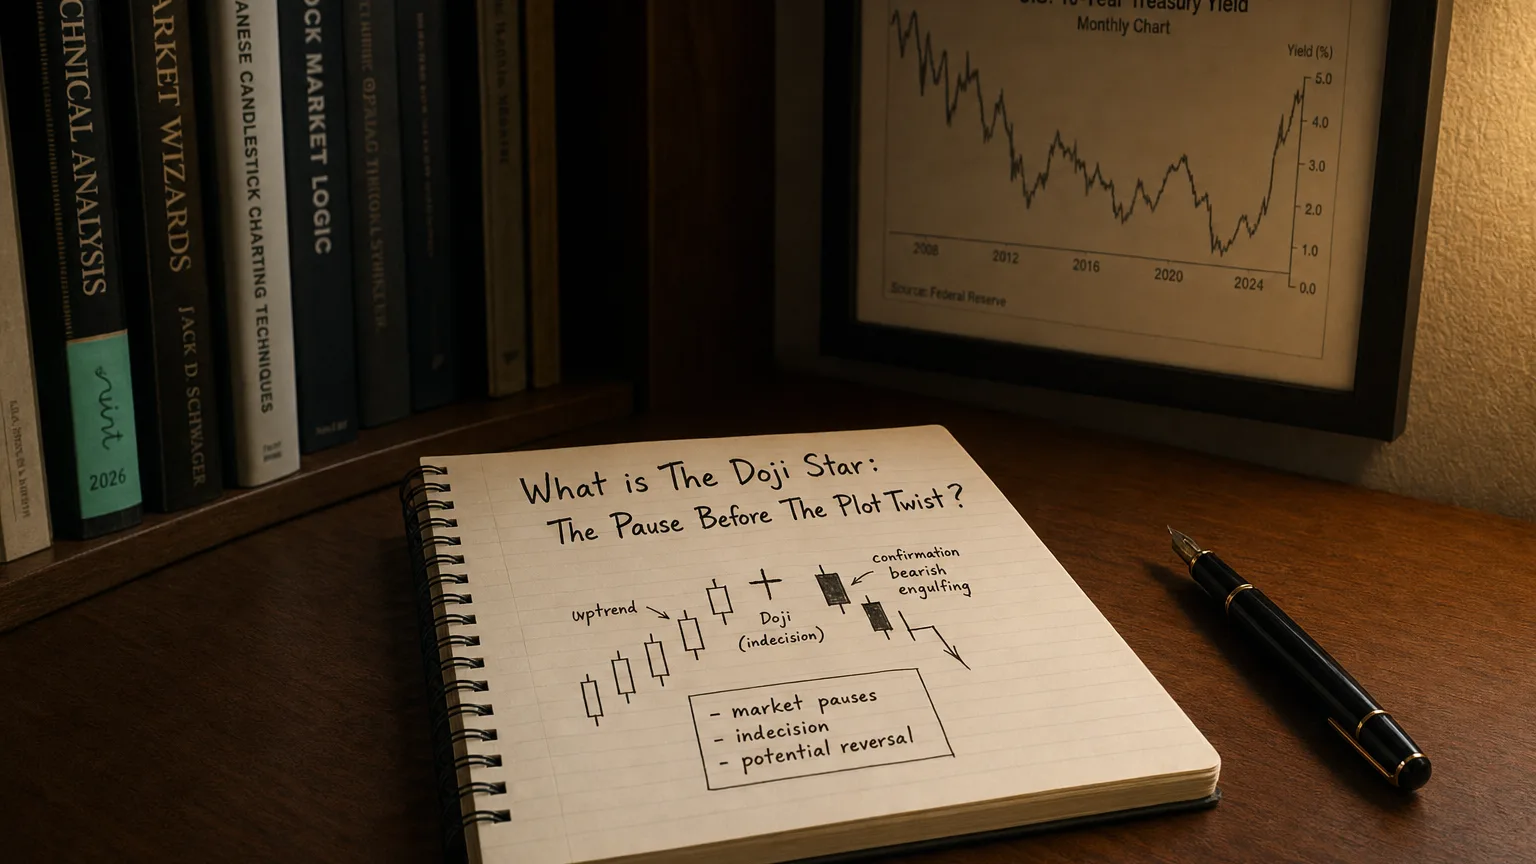
The Doji Star is a two-candle reversal pattern that forms at the top or bottom of a trend, signaling that momentum is stalling and a major shift could be imminent. It features a dramatic change in conviction, where a strong candle is followed by a Doji — showing indecision, uncertainty, and reversal pressure building.
It comes in two forms:
-
Bullish Doji Star (at the bottom of a downtrend)
-
Bearish Doji Star (at the top of an uptrend)
Think of the Doji Star as the pause before the plot twist — the market’s telling you:
“Something big is coming.”
Structure of the Doji Star Pattern
This pattern consists of two candles:
Bearish Doji Star (at the top)
-
Candle 1: A long bullish candle — trend continues upward with strength.
-
Candle 2: A Doji that gaps above the previous candle’s close — but shows no follow-through from buyers.
Bullish Doji Star (at the bottom)
-
Candle 1: A long bearish candle — heavy selling pressure.
-
Candle 2: A Doji that gaps down — but fails to continue lower, showing potential reversal tension.
The gap between the first and second candles is crucial — it shows a break in momentum. The Doji Star is the market freezing right before one side gives way.
Interpretation and Market Psychology
| Component | Market Message |
|---|---|
| Strong first candle | Continuation of current trend (bullish or bearish) |
| Doji with gap | Momentum halts — indecision at a critical moment |
| No confirmation yet | Market is poised to reverse, but needs follow-through |
| Volume spike? | Adds major conviction to the reversal setup |
The Doji Star isn’t just about indecision — it’s about trend fatigue. One side has been dominating, but the second candle shows they may be running on fumes.
Strategic Use Cases
-
Reversal Signal Setup
-
Wait for a third candle that confirms direction:
-
Bearish candle after Bearish Doji Star = go short
-
Bullish candle after Bullish Doji Star = go long
-
-
-
Early Exit Warning
- Time to consider locking in gains or tightening stops if you’re already in a trade.
-
Breakout Trap Filter
- Helps identify false breakouts that stall and reverse at highs/lows.
-
Pair with Oscillators
- Combine with RSI divergence, MACD cross, or volume contraction for increased confirmation.
Professional Applications
-
Swing Trading Entry/Exit Points: Used on daily charts to mark the turn.
-
Candlestick-Based Scanners: Common in reversal-focused screeners and algo triggers.
-
Quant Models: Flagged as a reversal risk signal when modeling trend shifts.
-
Portfolio Risk Controls: Use to rotate out of overheated positions or rotate into value post-selloff.
Limitations
-
Confirmation required: Always wait for a third candle to confirm the reversal.
-
Gaps may be subtle in some markets (like forex) — context and support/resistance matter.
-
Can whipsaw in sideways or low-volume environments — works best after strong trends.
Summary
The Doji Star is a sharp and powerful two-candle reversal pattern that captures the exact moment the market loses conviction. It shows up when buyers or sellers stall out, and the balance of power is about to shift. With confirmation, it becomes a high-impact entry signal or a critical risk alert at the turning point of a trend.