This rare but powerful three-candle pattern signals extreme indecision followed by a decisive bullish takeover, often marking a significant market bottom.
There is nothing new on Wall Street or in stock speculation. What has happened in the past will happen again and again.

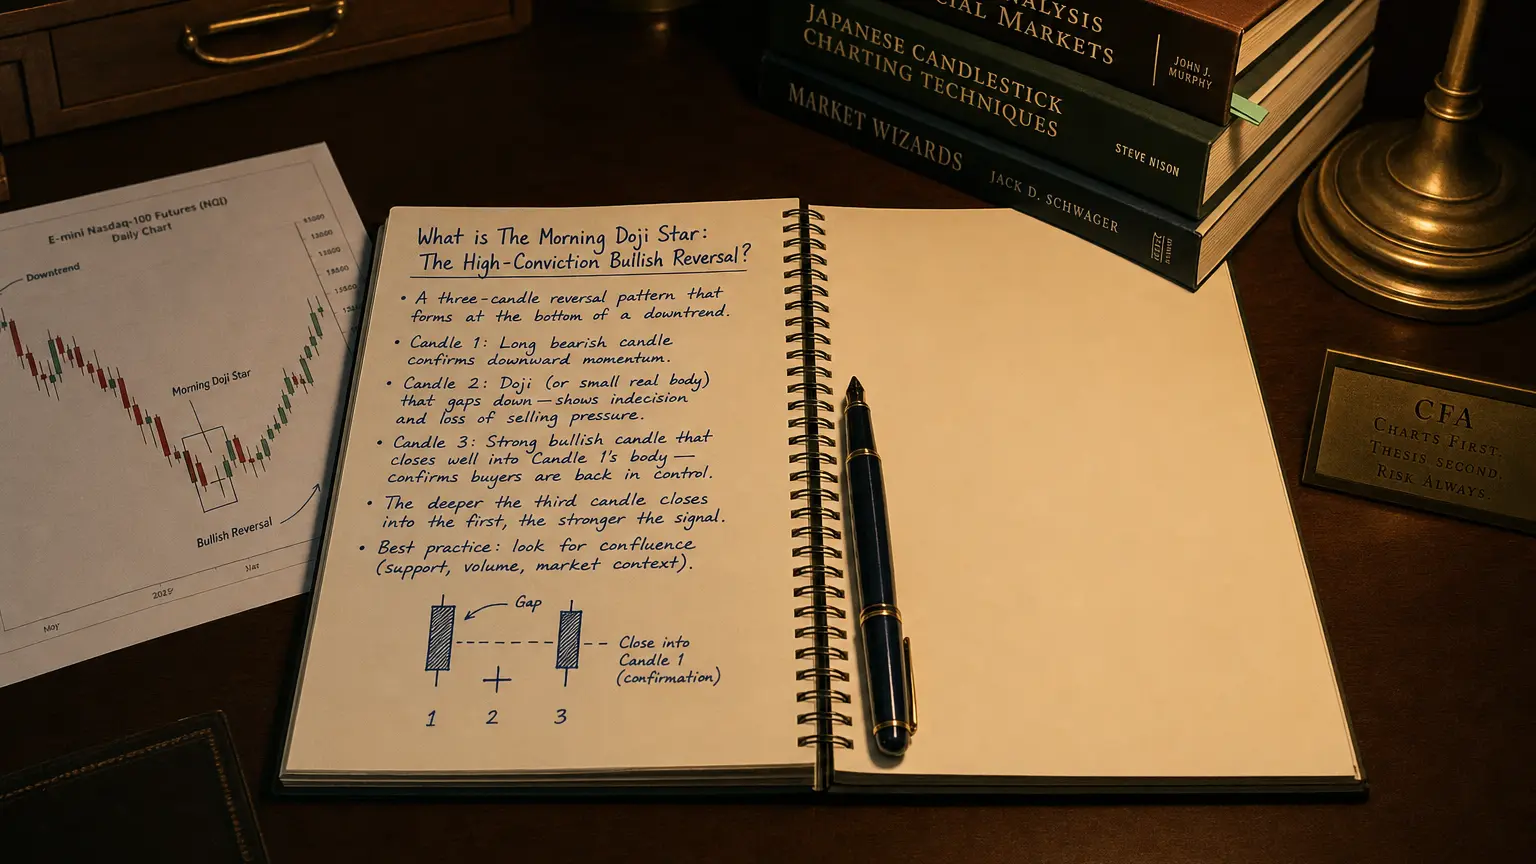
The Morning Doji Star is the stricter cousin of the classic Morning Star: the middle candle must be a doji (open ≈ close). This doji, stranded below the prior close, screams indecision after heavy selling; the third candle’s gap-up and strong close confirm that bulls just yanked the wheel. Bulkowski’s test of 932 occurrences shows the pattern flips price upward ≈ 76 % of the time—placing it in the upper tier of candlestick reversals, though still rare (frequency rank ≈ 78/103).
| Pattern type | 3-candle bullish-reversal |
|---|---|
| Key signal | Down-trend exhaustion followed by a gap-down doji “pause” and a strong gap-up recovery bar |
Identification checklist
| Candle | Requirements (bullish set-up) | Why it matters |
|---|---|---|
| 1 – Bearish thrust | Long red/black body closing at new swing low | Bears in full control |
| 2 – Doji star | True doji that gaps down; shadows allowed, body tiny | Sell pressure pauses; uncertainty spikes |
| 3 – Bullish confirmation | Long green/white body that gaps up, closes ≥½ way into Candle 1’s body (ideal: above its midpoint) | Bulls re-assert, trapping shorts |
* For a bearish mirror, flip colors/direction and form it after an up-trend (Evening Doji Star).
Market psychology
-
Capitulation – Candle 1 extends the down-trend; shorts feel comfy.
-
Stalemate – Doji star gaps lower but closes flat → supply/demand in balance, volatility still high.
-
Sentiment flip – Bulls open Candle 3 above the doji, steamroll to a strong close; shorts scramble, early dip-buyers add fuel.
Trader’s playbook
| Element | Typical tactic |
|---|---|
| Entry | Aggressive: buy on Candle 3 close; Conservative: buy only after price closes above Candle 3 high. |
| Initial stop | Under the doji’s low (or ATR × 1). |
| Targets | 1.5–3 R, nearest resistance cluster, or 20-EMA touch. |
| Validation filters | Volume ≥ 1.2 × avg on Candle 3, RSI bullish divergence, pattern printed near a daily/weekly support zone. |
| Time stop | If price hasn’t advanced ≥ 0.5 R within 3–5 bars, tighten or exit—momentum candles decay fast. |
Statistical tendencies
| Metric (Bulkowski daily US stocks) | Result |
|---|---|
| Bullish reversal rate | 76 % |
| 10-day performance rank | 61 / 103 |
| Frequency rank | 78 / 103 |
Edge improves when Candle 3 volume surges and the pattern forms after a ≥ 5-bar decline.
Strengths & limits
Pros
-
Visually obvious three-bar script—scanner friendly.
-
Tight invalidation—stop nests below the doji.
-
High reversal reliability versus many other patterns.
Cons
-
Rare; patience required.
-
Performs poorly if Candle 3 is small or volume is light (fake bounce).
-
Vulnerable to overnight news gaps that can negate setup—check economic & earnings calendar.
Quick visual cue
⬇️ Down-trend
🟥 Long red bar
↙ (gap down)
✝️ Tiny doji
↗ (gap up)
🟩 Long green bar closes > ½ red body
✅ Buy with stop under doji low
Summary
The Morning Doji Star is the chart’s sunrise after a bearish night—three candles that move from capitulation to indecision to bullish conviction. Trade the breakout of Candle 3 (or its high), anchor your stop beneath the doji, and insist on volume or momentum confirmation. Do that, and this rare but potent pattern can light up early entries into fresh upside moves while keeping risk on a tight leash. Rock on and manage that risk!