How this rare, high-conviction pattern uses a Doji to signal that a powerful uptrend has hit a wall of indecision.
There is nothing new on Wall Street or in stock speculation. What has happened in the past will happen again and again.

The Harami Cross is a sharpened variant of the Harami reversal pattern in which the second candle is not just small—it is a Doji (open ≈ close). This makes the signal more potent: the market shifts from decisive trend candle to complete indecision in one session, often foreshadowing a momentum flip. It can appear in two forms:
| Variant | Trend Context | Candle 1 (“Mother”) | Candle 2 (“Cross”) | Primary Implication |
|---|---|---|---|---|
| Bullish Harami Cross | After a decline | Long bearish body | Doji fully inside Candle 1’s body | Possible bearish exhaustion → upside reversal |
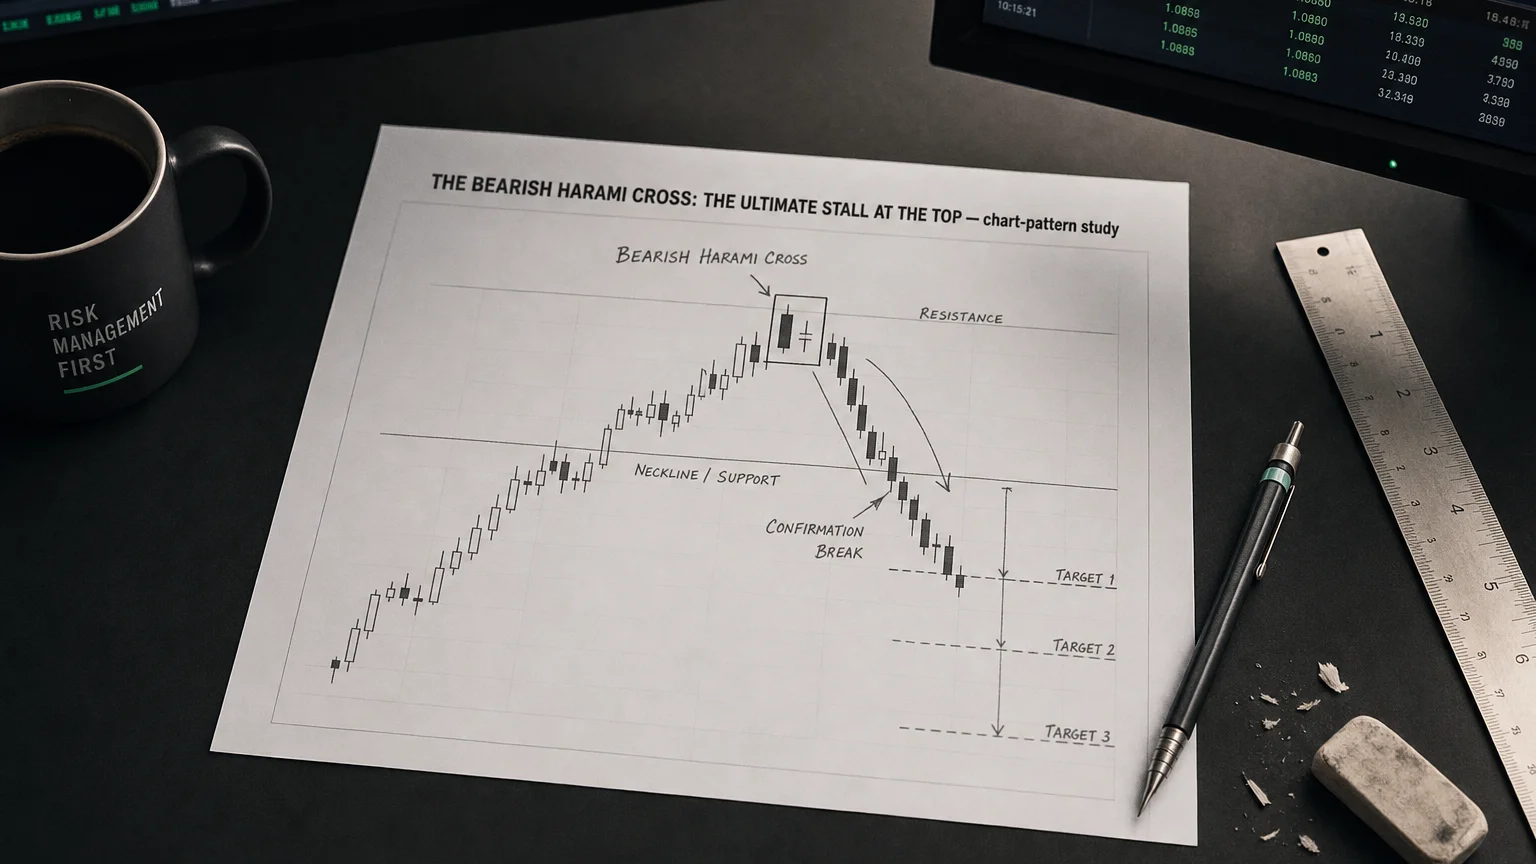
| Bearish Harami Cross | After a rally | Long bullish body | Doji fully inside Candle 1’s body | Potential bullish fatigue → downside reversal |
Key rule: The Doji’s real body must be entirely contained within the high–low range of Candle 1.
Market Psychology
-
Dominant trend bar (Candle 1) — bulls/bears firmly in control.
-
Gap or constrained open (Candle 2) — a stalemate emerges.
-
Doji close — neither side extends the move; energy compresses, setting the stage for an opposing push if confirmed.
Confirmation & Trade Tactics
| Step | Bullish Setup | Bearish Setup |
|---|---|---|
| Trigger | Break above the Doji’s high on Day 3 | Break below the Doji’s low on Day 3 |
| Stop-Loss | Just below the Doji’s low | Just above the Doji’s high |
| Targeting | First resistance / mean-reversion zone or ATR multiples | First support / mean-reversion zone or ATR multiples |
| Enhancers | Oversold RSI, positive MACD divergence, volume dry-up on Doji | Overbought RSI, negative divergence, volume contraction on Doji |
Practical Filters
-
Location matters: Must sit at trend extremes (not mid-range chop).
-
Volume context: A Doji on diminished volume underscores trader hesitation; a surge on the confirmation bar validates the turn.
-
Macro catalysts: Look for earnings, data, or news that could justify the stall-and-reverse dynamic.
Summary
A Harami Cross compresses strong trend energy into a Doji of total indecision, making it one of the clearest early warnings that prevailing momentum is faltering. When the next candle breaks beyond the Doji’s range, the pattern morphs from a yellow flag into a high-probability reversal trigger. Traders exploit it by pairing strict confirmation entries with tight stops around the Doji, especially when the pattern aligns with support-resistance zones, volume clues, and momentum divergences. Deployed with discipline, the Harami Cross turns hesitation on the chart into calculated opportunity.
Q · 01What is The Bearish Harami Cross?+