The High-Wave Candle is a financial concept covered in this article. How to Interpret and Trade this Powerful Signal of Uncertainty
There are old traders and there are bold traders, but there are very few old, bold traders.
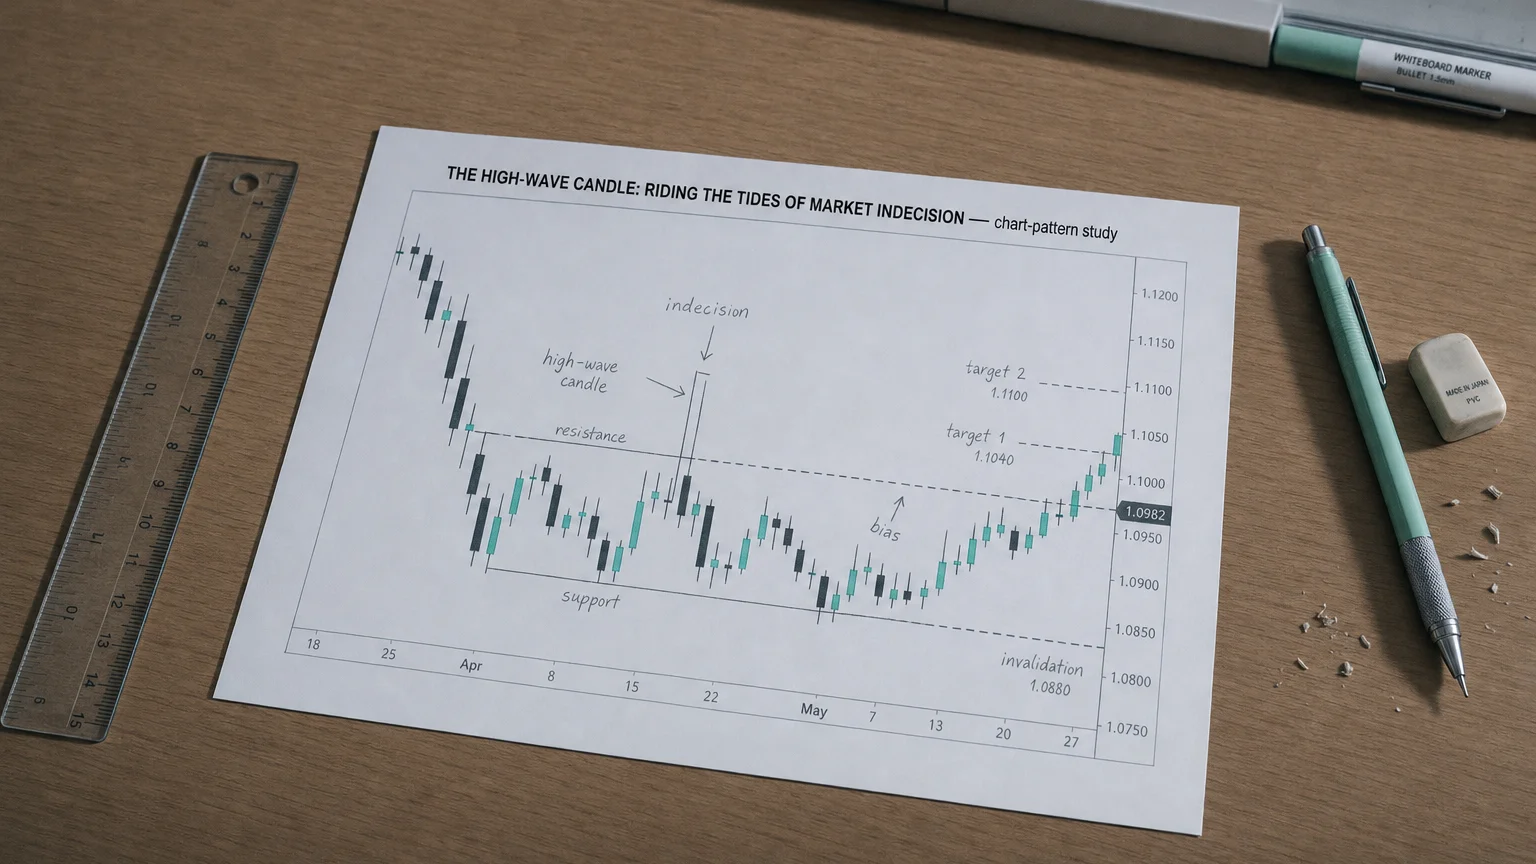
Picture a chaotic battle where both armies charge furiously, gain ground, lose it, and end the day right back where they started, exhausted. This is exactly what a High-Wave candlestick represents on a price chart. It’s a distinct and dramatic pattern showing a session of wild price swings and extreme volatility, which ultimately resolved into a stalemate. This signal of significant market indecision is a crucial warning sign for traders, indicating that the current trend’s conviction is faltering.
What is a High-Wave Candle?
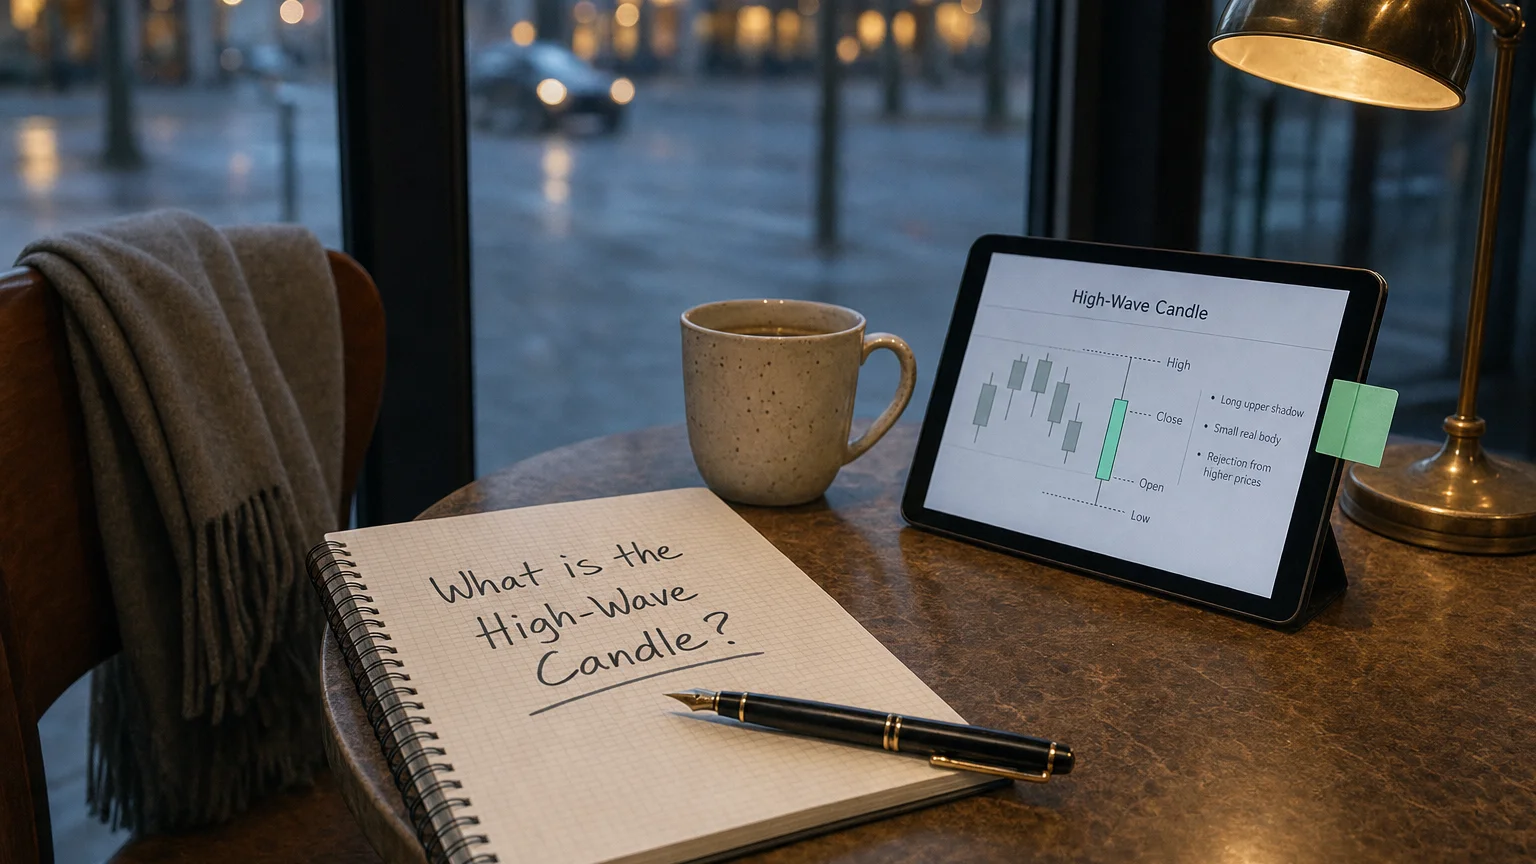
The High-Wave candle is a single-bar pattern that stands out due to its dramatic shape. It tells a story of a day filled with sound and fury, signifying nothing… yet. Its key characteristics are unmistakable:
Note the very small body compared to the extremely long upper and lower shadows, indicating a wide but indecisive trading session.
Key Characteristics
- Small Real Body: The distance between the open and close price is minimal, showing very little net change for the session.
- Long Upper and Lower Shadows: This is its signature feature. The price made substantial moves both higher and lower during the session, creating long wicks on both ends.
- Color Neutral: Whether the small body is green/bullish or red/bearish is secondary. The overwhelming message is indecision, regardless of which side ‘won’ by a tiny margin.
- Context is Key: It often appears after a strong, sustained price move, hinting that the prevailing trend might be running out of steam or is about to take a pause.
“There are old traders and there are bold traders, but there are very few old, bold traders.”
— Ed Seykota, Pioneering systematic trend-following trader Market Wizards: Interviews with Top Traders, Jack D. Schwager (New York Institute of Finance, 1989), chapter “Ed Seykota — Everybody Gets What They Want” (1989)
The Psychology Behind the Chaos
A High-Wave candle offers a fascinating glimpse into the market’s collective mind. During the session, both bulls and bears made powerful attempts to seize control, causing the price to fluctuate dramatically and creating those long shadows. However, neither faction could maintain dominance. The session’s eventual close near its opening price underscores a perfect stalemate. It’s a clear sign of market confusion, a moment where conviction has evaporated, often preceding a significant shift in sentiment or a full-blown trend reversal.
Interpreting the Signal
When you spot a High-Wave candle, your first reaction shouldn’t be to jump into a trade, but to pause and pay attention. Here’s how to read it:
- It’s a Neutral Signal: By itself, this candle doesn’t predict whether the price will go up or down. It simply screams ‘UNCERTAINTY!’
- It’s a Caution Indicator: Think of it as a yellow traffic light on the chart. It suggests that now is a good time to reassess your open positions, tighten stops, or simply wait for more clarity before committing new capital.
- Location, Location, Location: Its significance skyrockets when it appears at a pre-existing, major support or resistance level. A High-Wave at a key technical juncture is a strong hint that a potential turning point is at hand.
A Practical Trading Guide
The number one rule for trading a High-Wave candle is this: never act on it in isolation. You must wait for the market to show its hand. Confirmation can come from several sources:
- The Next Candle: The most reliable confirmation is a subsequent candlestick that closes decisively above the High-Wave’s high (for a long trade) or below its low (for a short trade).
- Volume Spikes: A breakout from the High-Wave’s range accompanied by a surge in trading volume indicates strong conviction behind the move.
- Indicator Confluence: Use other tools in your arsenal. A breakout confirmed by a bullish MACD crossover, an RSI moving out of oversold territory, or a bounce from a key moving average adds significant weight to the signal.
Example Trade Setups
Bullish Setup: A High-Wave forms at a support level. The next candle is a strong green bar that closes above the High-Wave’s high. A trader could enter long on that close.
Bearish Setup: An asset in an uptrend forms a High-Wave near a resistance level. The next candle is a large red bar that closes below the High-Wave’s low. This provides a clear signal to enter a short position.
Pro-Tip: Managing Your Risk
Your stop-loss should be placed logically just beyond the opposite end of the High-Wave candle. If you go long on a break of the high, your stop-loss goes slightly below the low of the High-Wave. This defined range gives you a clear, manageable risk on the trade.
High-Wave vs. Its Cousins
It’s easy to confuse the High-Wave with other indecision candles. Here’s a quick guide to telling them apart:
- Doji Candle: Think of a Doji as the ultimate form of indecision. Its real body is even smaller, practically a horizontal line where the open and close are almost identical. A High-Wave shows a battle; a Doji shows a perfect freeze.
- Spinning Top: A Spinning Top also has a small real body, but its shadows are much shorter. It signals mild, everyday indecision. The High-Wave, with its dramatically long shadows, signals extreme uncertainty and high volatility.
Q · 01What is The High-Wave Candle?+