Understanding the master candle of market equilibrium and its powerful variations like the Dragonfly and Gravestone.
There is nothing new on Wall Street or in stock speculation. What has happened in the past will happen again and again.

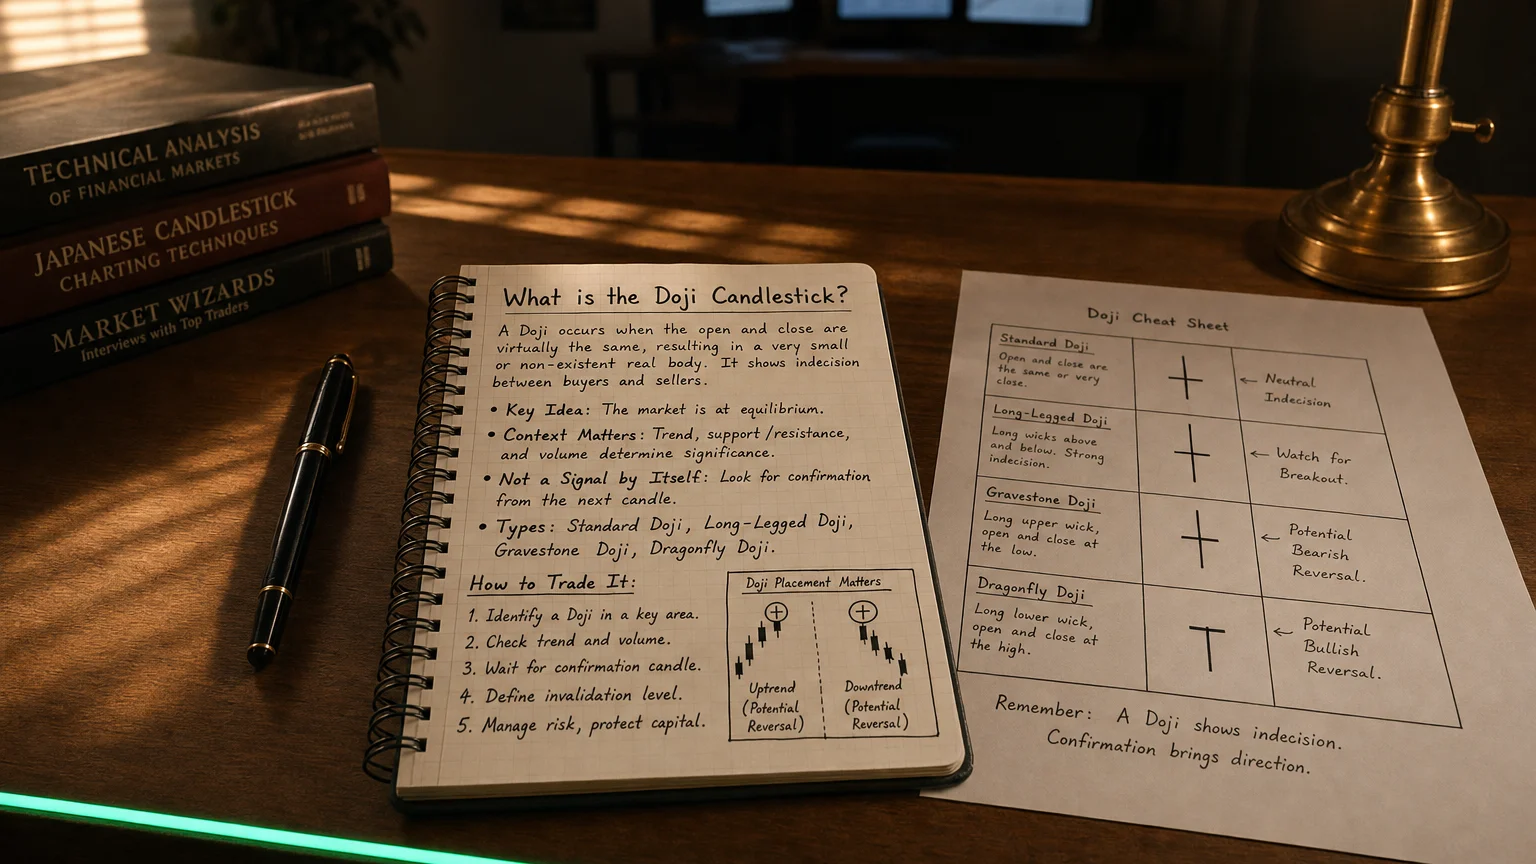
The Doji is a single-candle pattern that signals market indecision, trend hesitation, or an impending reversal. It forms when the opening and closing prices are nearly identical, resulting in a small or non-existent real body. What makes the Doji special is its ability to capture balance — neither buyers nor sellers win the session.
When a Doji appears, it’s like the market saying:
“I’m not sure… but something big could be coming.”
Structure of the Doji
A Doji typically has:
-
A small or flat real body (open ≈ close)
-
Long upper and/or lower shadows (wicks) — or sometimes none
-
Can appear in any trend, but is most meaningful at key turning points
Types of Doji Candles
| Doji Type | Visual | Interpretation |
|---|---|---|
| Standard Doji | + (Cross shape) | Neutral indecision — potential reversal or continuation |
| Long-Legged Doji | Long upper/lower wicks | Extreme indecision — high volatility and psychological standoff |
| Gravestone Doji | Open/close at low | Bearish signal — buyers tried to push up, but sellers crushed it |
| Dragonfly Doji | Open/close at high | Bullish signal — sellers pushed down, but buyers fought back strong |
Key Insight: The location of the Doji within the trend determines its strength and meaning.
Interpretation in Context
| Doji Appears In… | Market Message |
|---|---|
| Uptrend (at top) | Bullish exhaustion — possible reversal or pullback |
| Downtrend (at bottom) | Bearish exhaustion — possible reversal or bounce |
| Consolidation zone | Market unsure — expect breakout or volatility ahead |
-
A Doji on heavy volume? That’s institutional indecision — watch closely.
-
A Doji after a strong candle? Expect a trend challenge.
Strategic Use Cases
-
Trend Reversal Signal
- Use Doji as a setup bar — wait for confirmation with a breakout candle next.
-
Momentum Slowdown Detection
- Spot waning pressure before adjusting risk or tightening stops.
-
Breakout Preparation
- Dojis often appear right before price explosion — great in volatility-based strategies.
-
Support/Resistance Reactions
- Doji at key levels = the market is thinking hard — and preparing to move big.
Professional Applications
-
Chart Pattern Analysis: Doji marks critical inflection points in classical patterns (triangles, head and shoulders, etc.).
-
AI Pattern Libraries: Dojis are classified in machine learning models as trend uncertainty flags.
-
Volume Analysis Overlay: Doji + rising volume = high-quality alert in trading systems.
-
Multi-Timeframe Confirmation: Stronger when seen on higher timeframes (daily, weekly).
Limitations
-
Not a standalone signal: A Doji by itself is indecision, not a trade — always wait for confirmation.
-
Common in sideways markets: More meaningful when it breaks a trend rhythm or comes after a strong move.
-
Small Doji vs. Spinning Top: Very thin real bodies qualify as Doji; thicker = spinning tops (still indecisive, but different weight).
Summary
The Doji is a critical signal of uncertainty, hesitation, and transition — and when interpreted in the right context, it can be a launchpad for high-probability trades. Whether it’s capping a bull run or bottoming out in a downtrend, the Doji offers insight into the market’s internal struggle — and it often precedes explosive movement.