How to spot this powerful bullish reversal signal and understand the market psychology behind it.
There is nothing new on Wall Street or in stock speculation. What has happened in the past will happen again and again.

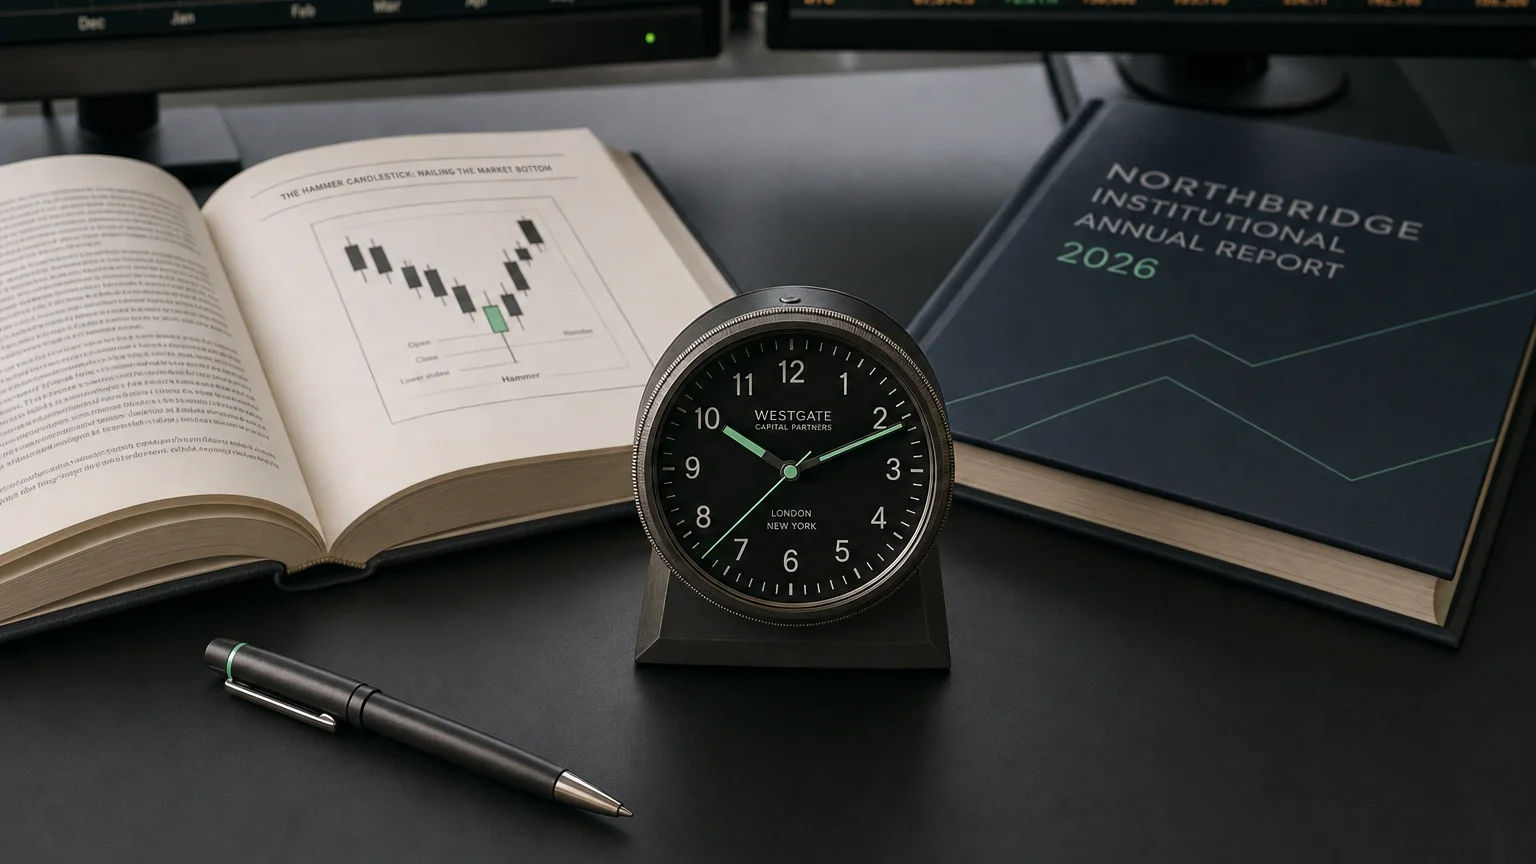
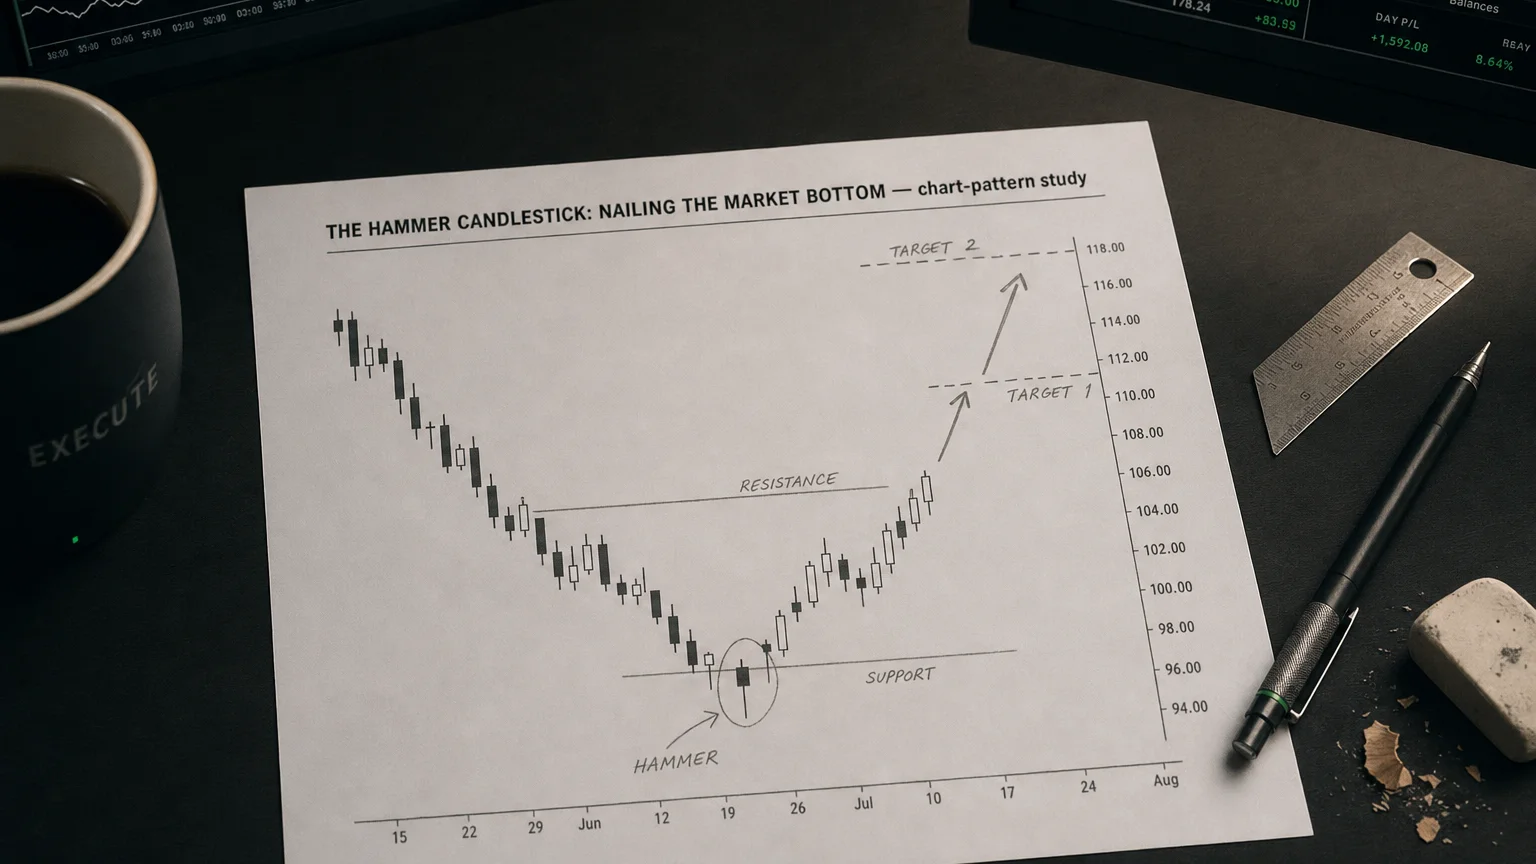
The Hammer is a single-bar bullish reversal pattern that appears after a decline and signals that sellers have lost control while buyers have begun to step in aggressively. The candle’s long lower shadow shows an intraday sell-off that was completely rejected, and the small real body near the high of the session reveals that price finished close to its opening level—handing momentum back to the bulls.
Pattern Construction
| Component | Description | Market Psychology |
|---|---|---|
| Lower shadow | At least 2× the length of the real body | Bears pushed price down, probing for stops and liquidity. |
| Real body | Small (bullish or bearish) and located in the upper third of the candle’s range | Buyers absorbed supply and closed the session near the highs. |
| Little / no upper shadow | Confirms buyers dominated the closing auction | Lack of profit-taking by bulls; sellers remained sidelined into the close. |
| Pre-condition | Appears after a downtrend, gap-down, or oversold leg | Context turns an ordinary lower-shadow candle into a high-probability signal. |
Visual: looks like a hammer—small head on top, long handle below.
Interpretation
-
Bearish Exhaustion – The long tail records an attempt to continue lower that failed.
-
Bullish Intraday Reversal – Strong demand lifted price back to (or above) the open.
-
Potential Trend Turn – When confirmed by a higher close in the next bar, momentum often flips up.
Trading & Risk-Management Tactics
| Use Case | Practical Application |
|---|---|
| Long Entry | Buy on close above the hammer’s high (or on the next candle’s breakout). |
| Stop Placement | Place protective stop below the hammer’s low—it marks the rejection pivot. |
| Sizing / ATR filter | Because the range can be wide, scale position size to volatility (e.g., % of ATR). |
| Confluence Boosters | • Major support / Fibonacci zone • Positive RSI or MACD divergence • Volume surge on hammer day |
Common Pitfalls & Filters
-
Needs Confirmation: A hammer without follow-through can be a bear-market pause; insist on a subsequent bullish close.
-
Not every lower-shadow bar is a hammer: Real body must be small and near the high.
-
Thin-liquidity traps: In illiquid symbols, isolated long-tail prints can be artifacts—validate with volume.
-
Trend Context: Ignore mid-range hammers in strong uptrends; they’re usually continuation noise.
Variations
| Variant | Location | Effect |
|---|---|---|
| Inverted Hammer | After a downtrend | Similar bullish implication but shows buyers testing upside first. |
| Hanging Man | Same candle shape after an uptrend | Bearish warning—long lower shadow marks distribution into strength. |
Key Takeaways for Portfolio & Trade Desks
-
The Hammer is a price-action snapshot of capitulation and demand absorption.
-
Best results occur when it prints at logical support or climactic sell-offs and is validated by stronger next-session buying.
-
Pair with momentum or volume studies for higher confidence; treat as a setup bar, not a complete trade by itself.
Deploy it wisely, and the Hammer turns market panic into strategic opportunity. 🛠️📊
Summary
The Hammer candlestick is a compact yet powerful signal that captures a moment of capitulation followed by decisive buying. When it forms after a decline, it marks the spot where downside momentum was rejected and demand overwhelmed supply—often foreshadowing a trend reversal or sharp relief rally.
Successful use of the Hammer hinges on three pillars:
-
Context – It must appear after a clear down-move or at significant support.
-
Confirmation – A subsequent bullish close validates the shift in control.
-
Risk Discipline – Stops belong just below the Hammer’s shadow, and position size should respect the candle’s range.
Blend the pattern with volume spikes, momentum divergence, or higher-time-frame support to elevate probability. Treat the Hammer as a setup bar, then let confirmation and strict risk rules turn that setup into a high-conviction trade.
Master these elements, and you’ll transform a simple candle into a reliable edge—swinging the market’s own “hammer” in your favor.
Q · 01What is The Hammer Candlestick?+