How this volatile candlestick pattern signals a climax in the battle between bulls and bears, often preceding a major trend change.
There is nothing new on Wall Street or in stock speculation. What has happened in the past will happen again and again.

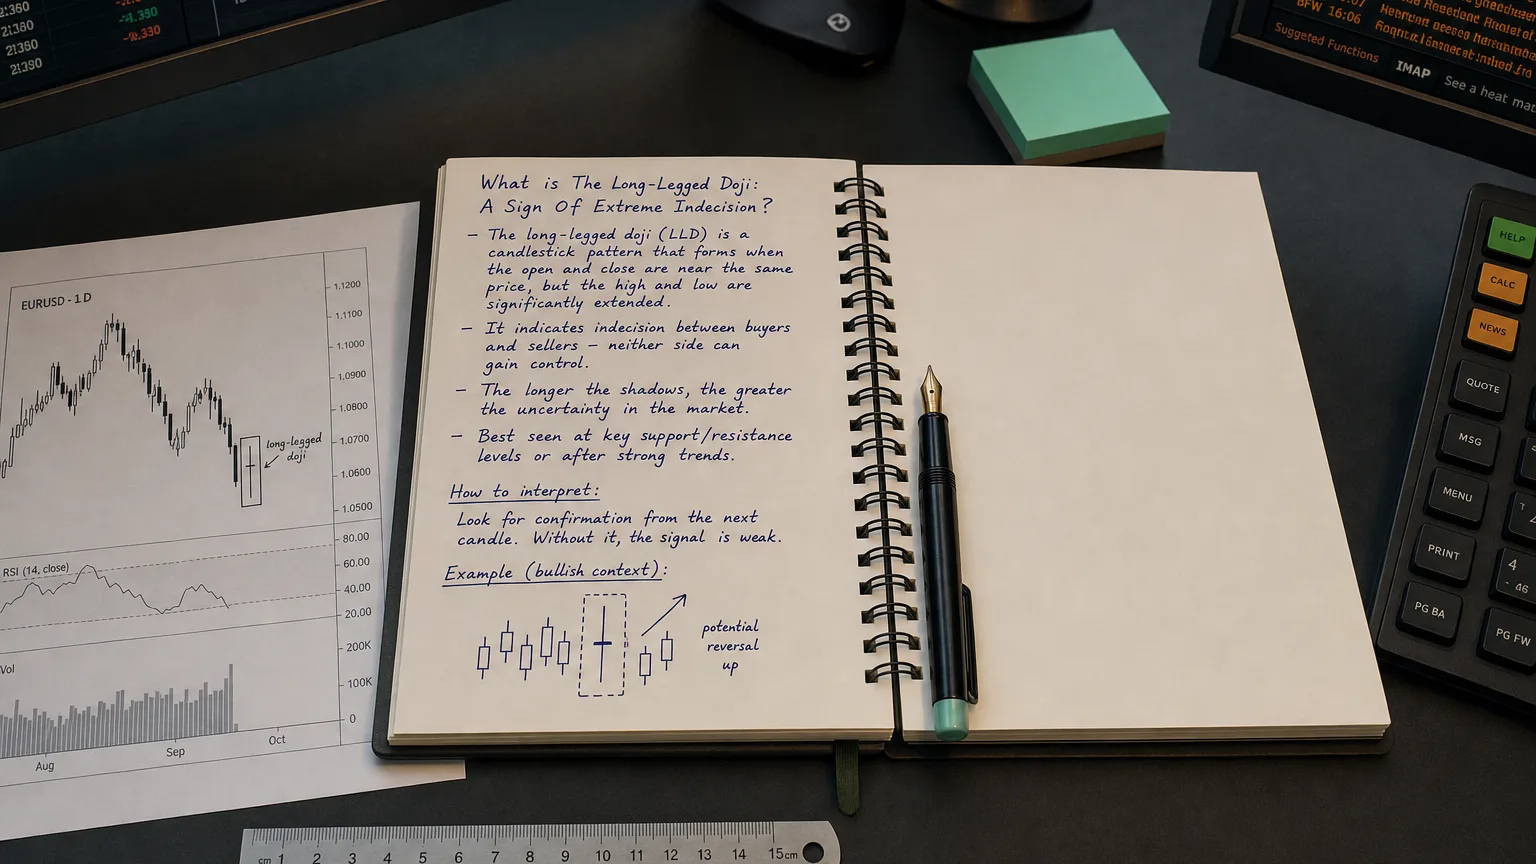
A Long-Legged Doji (LLD) is a single candlestick whose open and close are virtually identical, while its upper and lower shadows stretch far above and below the real body. The long wicks show that price probed aggressively in both directions during the session, yet finished where it began—graphic evidence of maximum indecision and heightened volatility. Traders watch for it after extended up- or down-moves because it can herald consolidation or a potential reversal once follow-through confirms.
Recognition checklist
| Rule | Requirement | Why it matters |
|---|---|---|
| Real body | Open ≈ Close (difference ≤ 5 % of range) | Signals a stalemate between bulls & bears |
| Shadows | Long, roughly symmetric upper + lower wicks | Shows price explored both extremes |
| Trend context | Appears after strong trend (up or down) | Heightens odds of momentum shift |
| Volume filter (optional) | Above-average turnover | Confirms the skirmish involved committed players |
Market psychology
-
Volatility burst: both factions push price to extremes.
-
No victor: session ends flat—neither side wrests control.
-
Reset point: subsequent candle’s direction often tips the balance; a close beyond either wick can spark fresh momentum as trapped traders capitulate.
Trading blueprint
| Step | Bullish scenario (after down-trend) | Bearish scenario (after up-trend) |
|---|---|---|
| Confirmation | Buy on close above LLD high | Sell/short on close below LLD low |
| Initial stop | Just under the opposite wick | Just above the opposite wick |
| Targets | 1.5–3 R or first resistance/MAvg | Mirror for shorts |
| Filters that help | Oversold RSI divergence, volume ≥ 1.2× avg, support zone confluence | Overbought RSI, volume spike, resistance confluence |
| Time stop | If price fails to advance ≥ 0.5 R in 3–5 bars, scale out | Same |
Statistical tendencies
Tom Bulkowski’s 4.7 M-candle study found the LLD’s breakout direction essentially random; upward follow-through occurred 50.4 % of the time, downward 49.6 %. In other words, the candle alone carries little edge; confirmation and context are vital.
Independent equity/FX back-tests show win-rates jump to 52–56 % when:
-
the LLD forms at major support/resistance, and
-
traders act only after the next candle closes past a wick with volume > 125 % of average.
Strengths
-
Visually striking; easy to code/scan.
-
Offers tight, symmetrical risk parameters (stops just outside wicks).
-
Useful early-warning flare for potential regime change or volatility compression.
Limitations & pitfalls
-
Edgeless in isolation—random breakout probability demands confirmation.
-
Common on intraday charts; many prints are mere noise.
-
Easily confused with other doji variants; verify both wicks are pronounced.
Quick visual cheat-sheet
-
⬆/⬇ Strong prior trend
-
┃ ← long upper wick
-
┼ ← open ≈ close (tiny body)
-
┃ ← long lower wick
-
⌛ Wait for next candle to break a wick → trade that direction
Summary
The Long-Legged Doji captures a tug-of-war climax—huge intraday swings with no net progress. By itself it’s a neutral signal, but paired with a decisive close beyond either wick and supportive volume or structure, it becomes a precise, low-risk trigger for traders hunting reversals or volatility breakouts. Treat the doji as a question mark, not an answer—let the very next price bar tell you which side just won the fight, set your stop on the far side of the candle, and aim for at least 1.5 R so the occasional whipsaw doesn’t kick your P&L off balance. Rock the confirmation, manage the risk, and let the market’s indecision fuel your next move.