How this single-candle pattern warns that a rally has failed, signaling a potential reversal to the downside.
The goal of a successful trader is to make the best trades. Money is secondary.

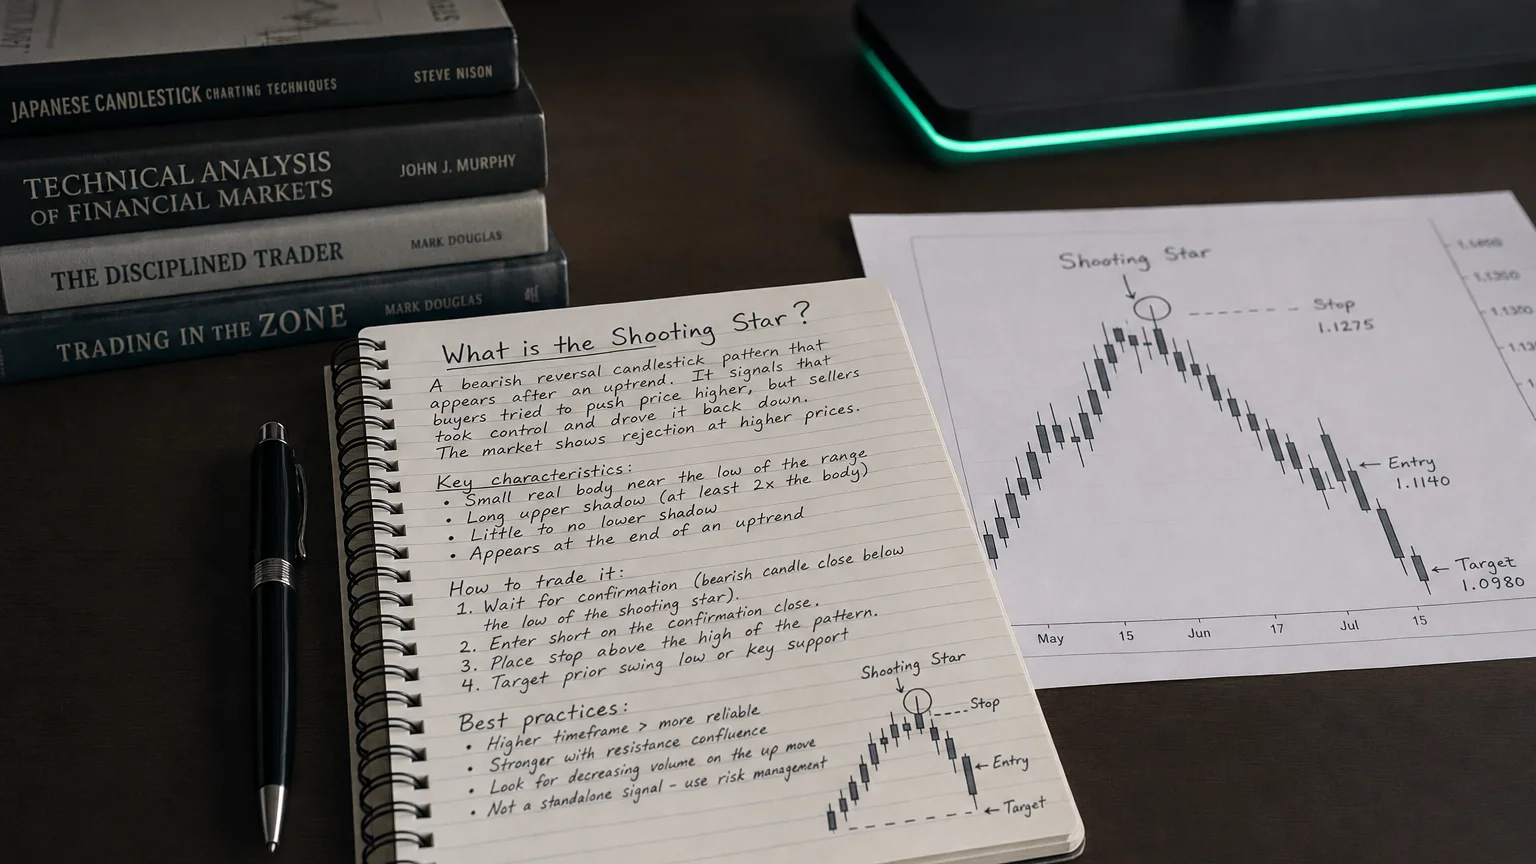
A Shooting Star is a single-candle bearish-reversal pattern that prints after an advance. It has a small real body near the session low, a very long upper shadow (≥ 2× the body), and little-to-no lower shadow. Visually it resembles an upside-down hammer: price shot up like a rocket, stalled, then fell back to earth—hence the name.
Recognition checklist
| Rule | Specification | Why it matters |
|---|---|---|
| Prevailing trend | Clear up-trend or sharp rally | Pattern reverses strength, not weakness |
| Upper shadow | ≥ 2 × body height | Shows bulls lost control at the top |
| Real body | Closes in the lower third of the candle’s range; colour unimportant (bearish close preferred) | Bears managed to push price back down |
| Lower shadow | Tiny or absent | Emphasises complete intraday rejection |
| Confirmation | Next candle closes below the Shooting Star’s low | Filters frequent head-fakes |
Market psychology
-
Euphoria: buyers drive price to a fresh high (long upper wick).
-
Failure: supply overwhelms demand; bulls who bought late are trapped.
-
Shift: if price follows through lower, stop-loss orders and profit-taking accelerate a downside move.
Trader’s playbook
| Step | Aggressive | Conservative |
|---|---|---|
| Entry | Sell/short at or just after Shooting Star close if volume spikes | Sell/short only after a close below the candle’s low |
| Initial stop | Above the candle’s high (or ATR × 1) | Same |
| Targets | 1.5–3 R, prior support, or 20-EMA touch | Same; trail once +1 R |
| Edge boosters | Overbought RSI/divergence, pattern printed at major resistance or Fibonacci extension, volume ≥ 1.2 × avg | Ditto |
If price hasn’t moved ≥ 0.5 R within 3–5 bars, tighten or scratch—the edge decays quickly.
Statistical tendencies*
| Metric | Result |
|---|---|
| Bearish follow-through (Bulkowski study) | ≈ 65 % continue down |
| Frequency | Common (top-30 of 103 patterns) |
| Average 10-day move when confirmed | ~–6 % on U.S. equities |
*Back-tests show reliability jumps when the upper shadow is at least 2.5 × body and volume is elevated.
Strengths & limitations
Pros
-
Visually obvious; easy to scan or code.
-
Tight, logical stop just above the wick.
-
Appears frequently on liquid instruments, offering ample opportunities.
Cons
-
High false-signal rate without confirmation (one candle ≠ trend change).
-
Performs poorly inside low-volume or news-gap conditions.
-
Easy to confuse with Inverted Hammer if prior-trend context is ignored.
Quick visual cheat-sheet
-
⬆️ Up-trend
-
│
-
┃ long upper wick
-
─┼─ tiny body near low
-
▽ close in lower third
-
⛔ Confirmation = break/close below low
Summary
The Shooting Star is the chart’s flashing caution light at bullish extremes—a single session where buyers lose the battle and bears fire the opening shot. Treat it as an alert, then:
-
Demand confirmation with a decisive close under the candle’s low.
-
Set stops just above the wick to keep risk surgical.
-
Hunt 1.5–3 R pay-offs or the next support shelf, exiting fast if momentum stalls.
Trade with that discipline, and the Shooting Star becomes a powerful, low-risk trigger for catching early downside reversals while the crowd is still gazing at the “stars.” Rock on and manage that risk!