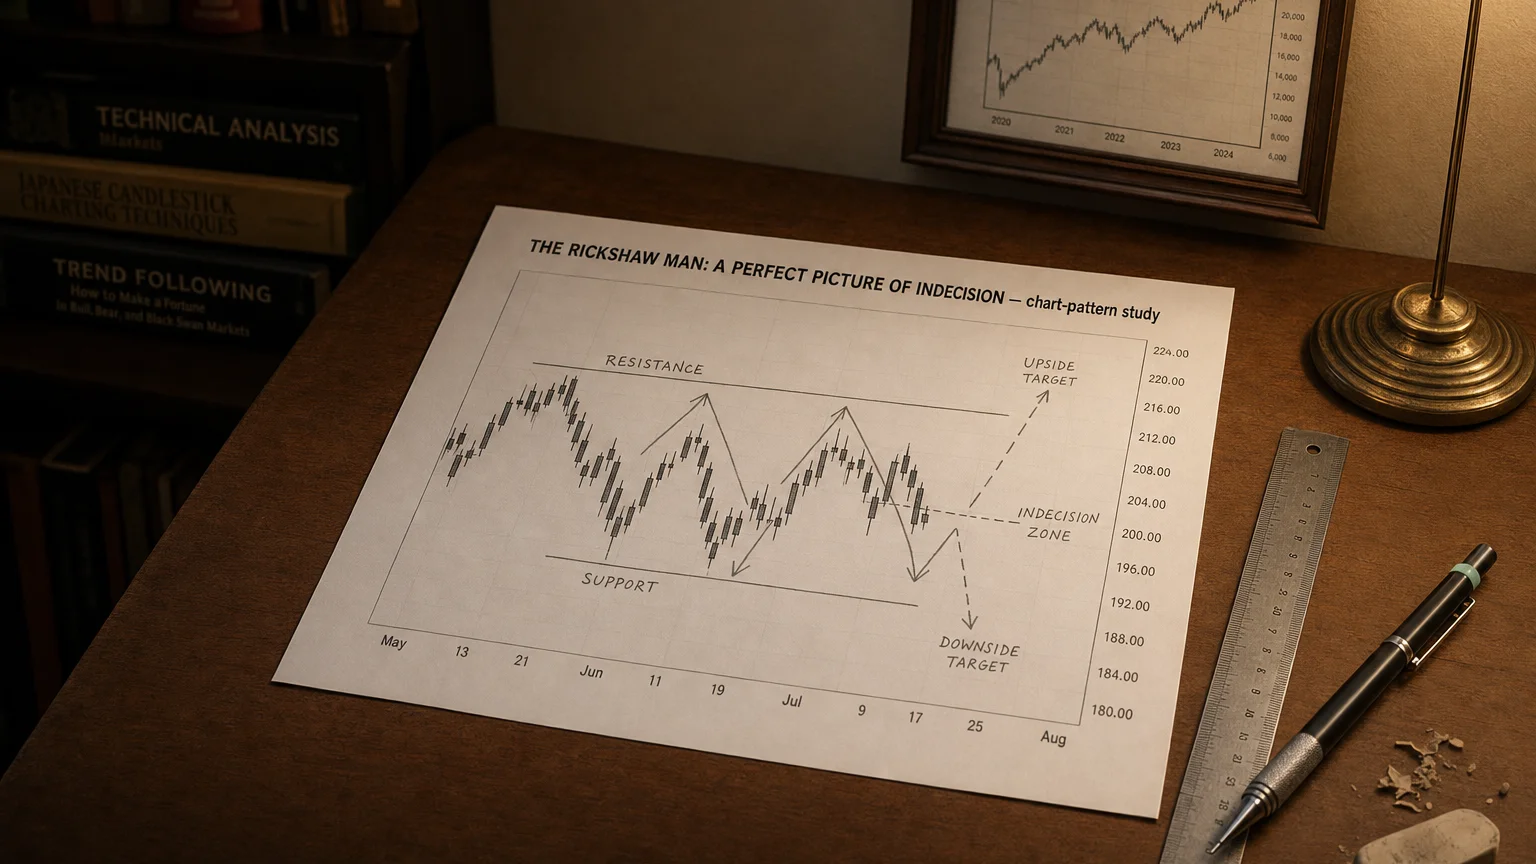
How this perfectly symmetrical Doji pattern signals a market at a complete standstill, often preceding a major volatility event.
The goal of a successful trader is to make the best trades. Money is secondary.

The Rickshaw Man is a single-bar candlestick that looks like a long-legged doji whose wafer-thin body sits dead-center between two extended shadows. Open ≈ Close (doji), the high and low are both pushed far away, and the midpoint body placement distinguishes it from a generic long-legged doji. Classic texts frame it as the market’s loudest cry of “maximum indecision.”
Identification checklist
| Rule | Specification | Why it matters |
|---|---|---|
| Body size | Open and close within ~5 % of each other | Defines the doji core |
| Shadow length | Upper + lower wicks long and roughly equal | Shows bulls & bears both ran the price hard |
| Body position | Midpoint of total range (±10 %) | Signals neither side kept an edge |
| Trend context | Appears after long moves or inside choppy zones | Gives clues about likely fallout |
Some scanners simply tag any long-legged doji whose body sits in the middle third of the range as a Rickshaw Man.
Market psychology
-
Volatility burst: price rockets high, then plunges low—all in one bar.
-
Stalemate: despite the wild ride, it finishes where it began → balance of power.
-
Fork in the road: the next candle decides—break above the upper wick often squeezes shorts; break below the lower wick can trigger fresh longs to bail. Context (support/resistance, momentum divergence) tips the odds.
Trading blueprint
| Step | Long idea | Short idea |
|---|---|---|
| Confirmation | Buy only on a close above the upper shadow (or intrabar break + volume) | Sell/short only on a close below the lower shadow |
| Initial stop | Beneath the opposite wick or 1 × ATR | Above the opposite wick or 1 × ATR |
| Targets | 1.5 – 3 R, nearby S/R, or mean-reversion to 20-EMA | Mirror for shorts |
| Edge boosters | Oversold momentum, bullish divergence, pattern on key support, volume spike on breakout | Overbought, bearish divergence, resistance touch, volume spike on breakdown |
Back-tests by AnalyzingAlpha show the doji behaves best as a mean-reversion pivot—profits skew positive when traders fade the immediate breakout and ride the ensuing volatility pop.
Statistical tendencies (Bulkowski study)
| Metric | Result* |
|---|---|
| Breakout direction | ~50 / 50 (random) |
| Frequency rank | 72 / 103 patterns |
| Best 10-day move | +6 % after downward break in bearish regimes |
*Rickshaw Man treated as a subtype of the long-legged doji with centered body.
Strengths
-
Visually unmistakable: one dramatic bar—easy to code or eyeball.
-
Symmetric risk levels: wicks provide clean breakout/stop lines.
-
Volatility tell: flags potential explosive moves when the deadlock snaps.
Limitations & pitfalls
-
Neutral by itself: raw breakout is a coin-flip—wait for confirmation.
-
Common in choppy markets: many prints = noise; pair with structure/volume filters.
-
Can mark either exhaustion or continuation—context is everything.
Quick visual cheat-sheet
-
Long shadows ↑↓
-
┃
-
──┼── ← body ~ centre
-
┃
-
Break above top wick ⇒ long
-
Break below bottom wick ⇒ short
-
Stop on far side of candle
Closing Summary
The Rickshaw Man is the price chart’s rickety carriage swerving wildly yet parking exactly where it started—a perfect sign of tug-of-war parity. Treat it as an alert, not a standalone signal:
-
Wait for a decisive close beyond a wick, with volume or momentum backup.
-
Place stops just past the opposite wick to keep risk surgical.
-
Target 1.5 – 3 R or a mean-revert level, and bail quickly if price stalls.
Combine that discipline with higher-time-frame support/resistance or momentum divergence and you can harness the pattern’s volatility pop while letting indecision work for—not against—you. Rock on and trade smart!
Q · 01What is The Rickshaw Man?+