Homing Pigeon Candlestick Pattern
The Subtle Signal of a Bearish Storm Calming Down Learn the formula, key examples, and how investors use it in practice.

Overview
The Subtle Signal of a Bearish Storm Calming Down Learn the formula, key examples, and how investors use it in practice.
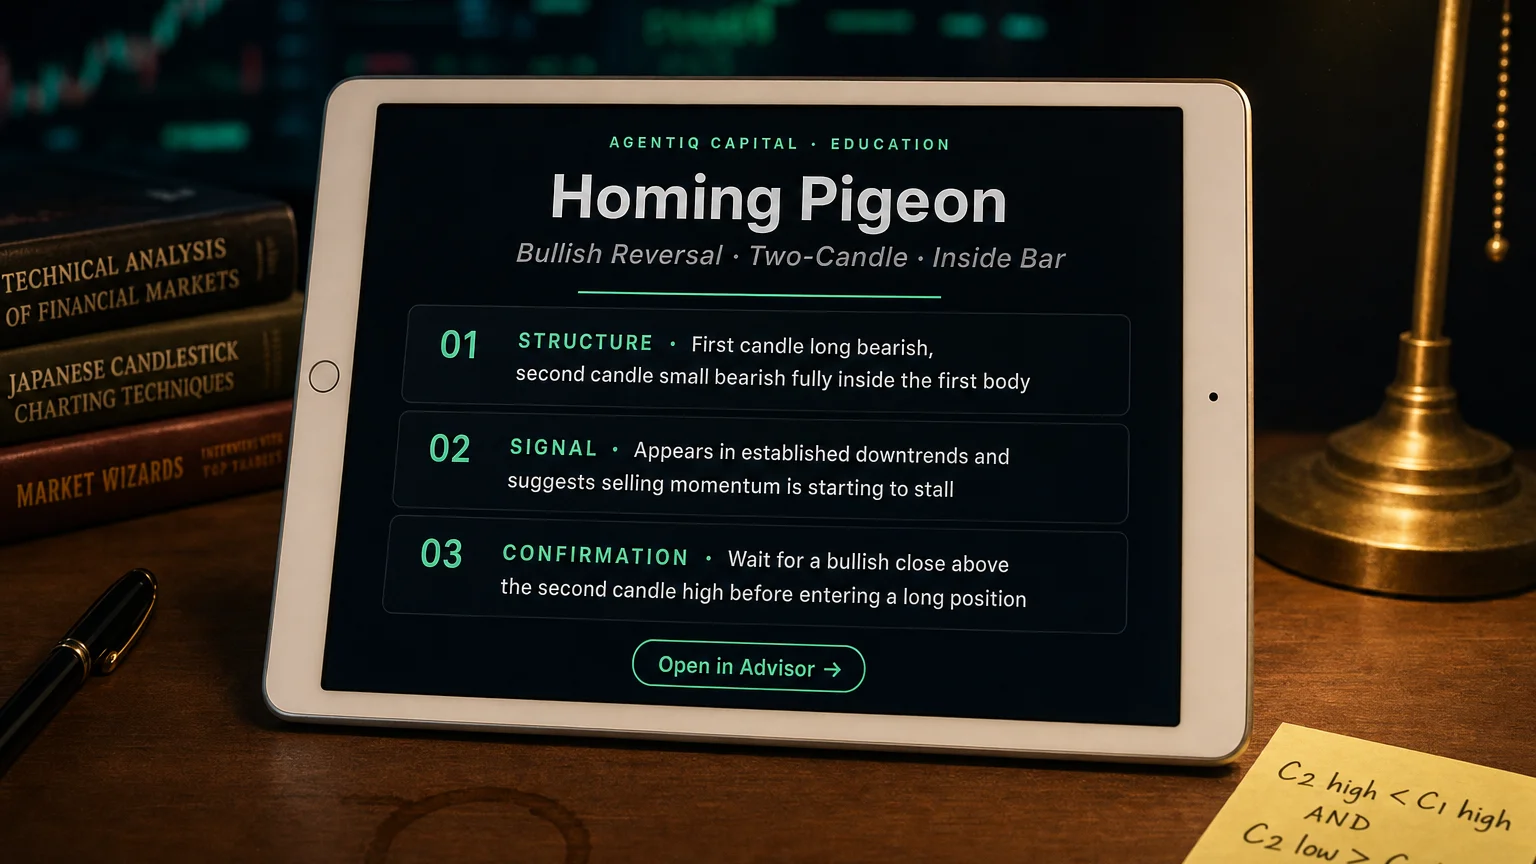
The Homing Pigeon is a two-candle formation singled out by Japanese technicians as a potential bullish-reversal signal that emerges after a down-trend. Both candles are bearish (closing lower than they open), but the second candle’s body is completely engulfed by the first candle’s body, creating a “pigeon nesting inside its home.” Traders interpret this as downside momentum stalling and buyers quietly absorbing supply.
Identification checklist
| Rule | Detail | Why it matters |
|---|---|---|
| Prevailing trend | Must be down | Pattern aims to catch an upside reversal |
| Candle #1 | Long or medium-length bearish body | Establishes strong bearish context |
| Candle #2 | Bearish body that opens & closes inside Candle #1’s body (shadows may protrude) | Shows contraction / loss of momentum |
| Confirmation (optional) | Close above Candle #2 high or a bullish candle next session | Filters out false positives |
Tip: Some chartists require the second body to close at, or above, the first body’s mid-point for extra conviction.
Market psychology
Aggressive sell-off (Candle #1) – sellers dominate; fear is obvious.
Inside contraction (Candle #2) – bears push again but fail to extend the range; bargain hunters step in, absorbing offers.
Energy coils – if price later flips above the second body, trapped shorts may cover, providing the initial fuel for a relief rally.
Trading approach
| Element | Typical tactic |
|---|---|
| Entry | Buy on a break/close above Candle #2 high, or on next bullish candle’s close. |
| Stop-loss | Just below Candle #1 low or recent swing low. |
| Targets | (i) First resistance zone / moving average, (ii) risk-multiple 2–3 R. |
| Filters that help | Volume uptick on confirmation; bullish divergence in RSI/sto-oscillator; pattern forming near major support/Fibonacci level. |
Historical performance
Bulkowski’s extensive test of 103 U.S. stocks (daily data 1991-2021) found the Homing Pigeon reversed upward only 44 % of the time, acting as a bearish continuation slightly more than random. However, when the reversal did succeed, the subsequent rise ranked 21st out of 103 patterns for size of move – suggesting infrequent but worthwhile pay-offs for confirmed signals.
Strengths
Simple, rule-based identification – easy to scan programmatically.
Tight risk: entry sits near recent extreme, allowing favorable R:R.
Works well as an add-on filter to oversold momentum or divergence setups.
Limitations & common pitfalls
Raw pattern is statistically weak without confirmation; many prints are mere pauses in persistent down-trends.
Performs poorly in thin-volume or news-driven gaps – use liquidity filter.
Confusion with bullish Harami: remember Harami’s second candle can be bullish; Homing Pigeon requires both candles bearish. website
Quick visual cue
long red candle
- small red body fully inside prior body
confirmation close above small body high
Summary
The Homing Pigeon is essentially a bear exhaustion pause inside a down-leg. On its own it’s a modest edge, but when allied with volume thrusts, momentum divergences, or strong structural support, it delivers a concise, rules-driven trigger to catch early upside reversals with tightly-defined risk. Trade it patiently, demand confirmation, and let the “pigeon” guide you out of bearish storms into clearer skies. 🕊️