Hikkake Pattern is a financial concept covered in this article. The Art of the False Breakout and How to Trade It
There is nothing new on Wall Street or in stock speculation. What has happened in the past will happen again and again.

The Hikkake (ひっかけ, “to trick or ensnare”) was introduced by CMT-holder Daniel L. Chesler in 2000-04 as a way to spot false breakouts that often precede an accelerated move in the opposite direction. Unlike classic candlestick names, it is classified as a price-action pattern rather than a traditional candle formation.
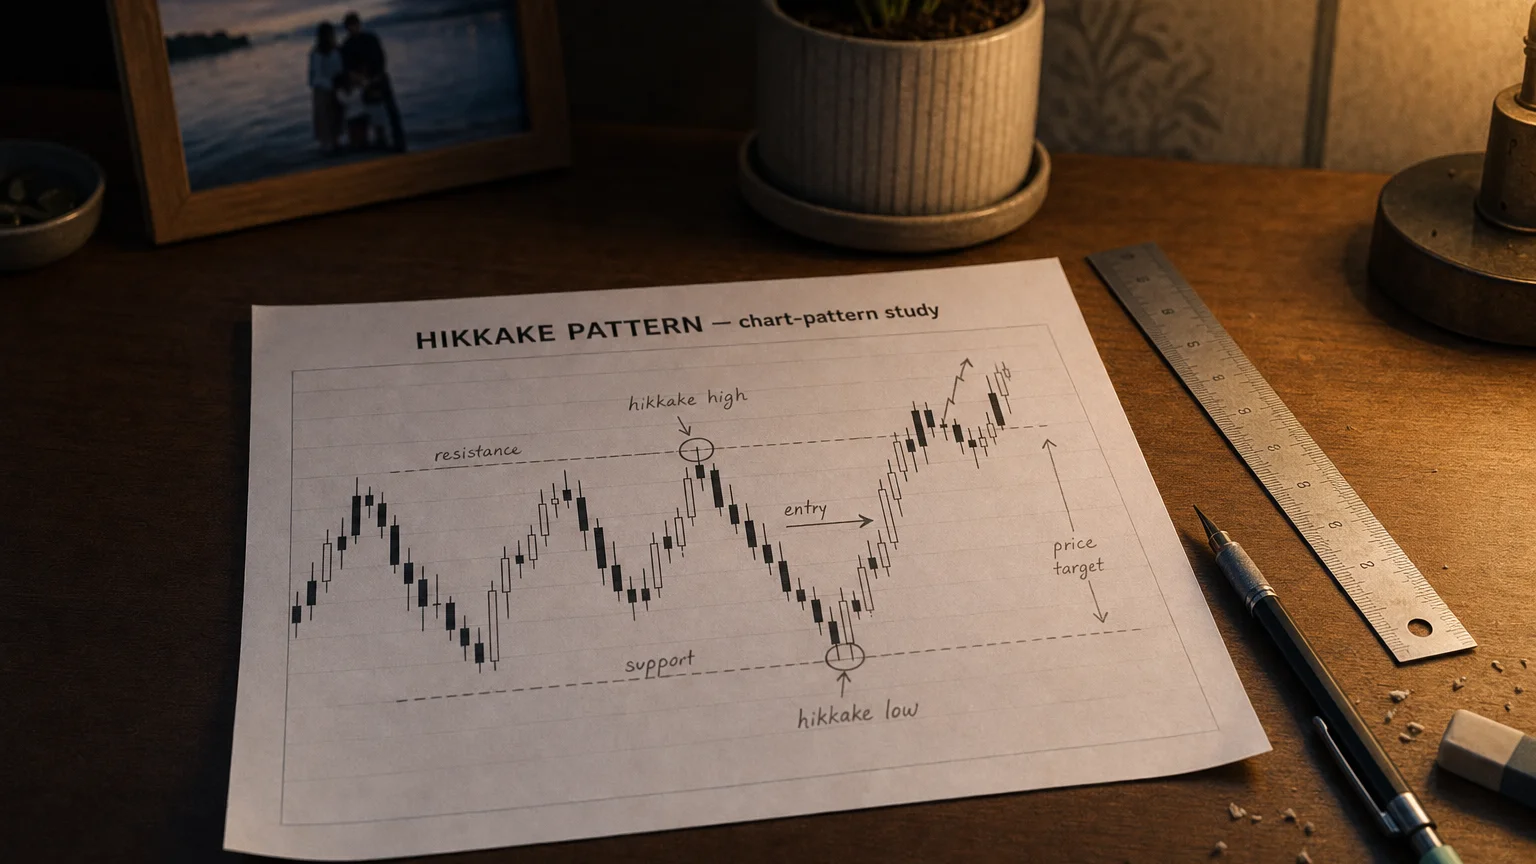
Anatomy of the basic set-up
| Step | Price action | Bullish example | Bearish example |
|---|---|---|---|
| A. Context bar (Day 0) | Any bar that sets the reference range. | Wide-range down-day | Wide-range up-day |
| B. Inside bar (Day 1) | High ≤ Day 0 high and low ≥ Day 0 low (an inside day). | Narrow range, inside Day 0 | Same |
| C. False break (Day 2-3) | Price pokes below (bullish) or above (bearish) the inside-bar range—tempting breakout traders. | ||
| D. Ensnare/confirmation (within next 3 bars) | Close back inside the Day 0–Day 1 range and then close above (bullish) or below (bearish) the inside-bar extreme. | Close > Day 1 high | Close < Day 1 low |
Modified Hikkake: adds one extra “drift” candle after the inside bar before the false break, improving reliability but reducing frequency.
Psychology behind the signal
-
Inside bar → compression: traders agree on value; energy builds.
-
False break: stops and breakout orders fire, pulling liquidity out of the book.
-
Snap-back close: trapped traders scramble to exit; smart-money joins, fueling momentum away from the trap side.
Trading rules commonly used
| Element | Bullish tactic | Bearish tactic |
|---|---|---|
| Entry | Buy at/just above the confirmation close. | Sell/short at/just below the confirmation close. |
| Initial stop | 1–2 ticks below Day 2 low (bullish) or above Day 2 high (bearish). | |
| Profit targets | (a) Multiple of risk (1.5-3 R) or (b) nearest S/R measured on higher-time-frame chart. | |
| Time filter | If price fails to progress within 3–5 bars, reduce risk or scratch. | |
| Companion tools | Volume surge, trend filter (e.g., 20-EMA slope), or volatility contraction indicators to avoid choppy regimes. |
Statistical tendencies
| Market | Win-rate (basic) | Avg. R-multiple | Notes |
|---|---|---|---|
| S&P 500 daily (1990-2024) | ~47 % | 0.65 | Improves if traded with primary trend. |
| FX majors 4-h (2015-2024) | 43–50 % | 0.55-0.90 | Works best near major swing levels. |
(Independent back-tests; results vary by filter and execution latency.)
Strengths
-
Objective, mechanically codable rules.
-
Often signals just before momentum bursts, giving favorable reward-to-risk.
-
Plays nicely with breakout or trend-continuation systems as a secondary entry module.
Limitations & common pitfalls
-
Low frequency on higher time frames.
-
Prone to noise in low-volume instruments—require a liquidity filter.
-
Traders often skip the confirmation step, mistaking any inside-bar break for a valid Hikkake.
Quick visual checklist
-
Inside bar?
-
False break of inside range?
-
Confirmation close across the opposite side within 3 bars?
-
Context: align with trend or key support/resistance?
Summary
The Hikkake pattern is a deceptively simple False-Break framework that exploits herd behaviour around inside-bar breakouts. When paired with disciplined confirmation and risk management, it offers a precise, low-cost trigger for both continuation and reversal plays—especially valuable for swing traders hunting momentum right as trapped liquidity fuels the next leg.
Q · 01What is Hikkake?+