A comprehensive guide to understanding what a company owns and how this foundational metric is used to evaluate its size, efficiency, and financial health.
You only have to be able to evaluate companies within your circle of competence. The size of that circle is not very important; knowing its boundaries, however, is vital.

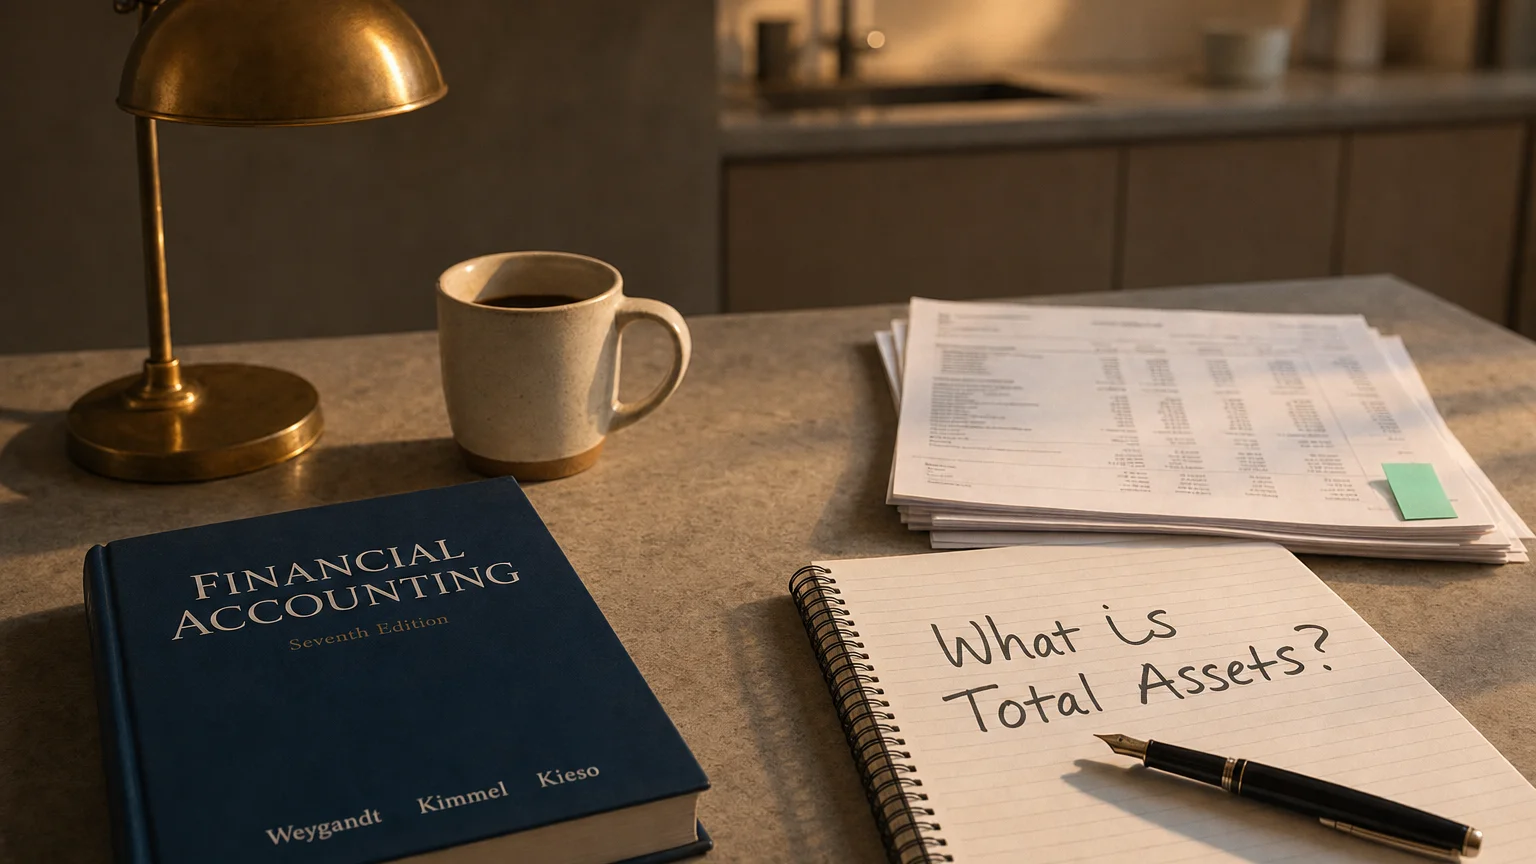
Total Assets represents the sum of all resources with economic value that a company owns and controls. It is one of the three major components of the balance sheet and a cornerstone of the fundamental accounting equation: Assets = Liabilities + Equity. In simple terms, total assets are everything the company can use to generate revenue and operate its business, from the cash in its bank account to the factories it operates. Understanding this figure is the first step in assessing a company’s scale, financial position, and operational capacity.
“You only have to be able to evaluate companies within your circle of competence. The size of that circle is not very important; knowing its boundaries, however, is vital.”
— Warren Buffett, Chairman & CEO, Berkshire Hathaway Berkshire Hathaway Chairman’s Letter 1996 (1996)
The Building Blocks: Current vs. Non-Current Assets
Assets on the balance sheet are categorized based on their liquidity, or how quickly they can be converted into cash. This splits them into two main groups:
-
1. Current Assets: These are all the assets a company expects to convert to cash or use up within one year or one operating cycle, whichever is longer. They are listed in order of liquidity and are essential for funding day-to-day operations. Examples include:
-
- Cash and Cash Equivalents: The most liquid assets, including currency, bank deposits, and short-term government bills.
-
- Accounts Receivable: Money owed to the company by its customers for goods or services already delivered.
-
- Inventory: Raw materials, work-in-progress, and finished goods that the company plans to sell.
-
- Prepaid Expenses: Payments made in advance for future expenses, like insurance or rent.
-
2. Non-Current Assets (or Long-Term Assets): These are assets that are not expected to be converted into cash within one year. They represent a company’s long-term investments in its future growth and operations. Examples include:
-
- Property, Plant, and Equipment (PP&E): Tangible, long-term assets like land, buildings, machinery, and vehicles. Their value is reduced over time through a process called depreciation.
-
- Intangible Assets: Non-physical assets that have value, such as patents, copyrights, trademarks, and goodwill.
-
- Long-Term Investments: Investments in other companies’ stocks and bonds, or real estate held for investment purposes.
The Formula and the Accounting Equation
The calculation for Total Assets is straightforward:
Formula:
The Golden Rule of Accounting
The value of Total Assets must always equal the sum of a company’s liabilities and shareholders’ equity. This is the fundamental accounting equation. It shows that a company’s resources (assets) are financed by either debt (liabilities) or owner contributions (equity). The balance sheet must always balance:
Why Total Assets Matter in Financial Analysis
Analysts, investors, and creditors use the Total Assets figure to gain critical insights into a company’s performance and financial structure.
- Assessing Company Size and Scale: Total Assets is the primary metric used to gauge the size of a company. A larger asset base generally indicates a larger, more established company with greater operational capacity.
- Evaluating Efficiency (Asset Turnover Ratio): This ratio measures how effectively a company is using its assets to generate revenue. A higher ratio is generally better. The formula is:
- Analyzing Profitability (Return on Assets - ROA): ROA indicates how profitable a company is in relation to its total assets. It shows how well management is using its resources to generate earnings. The formula is:
- Understanding Financial Structure (Debt Ratio): By comparing total liabilities to total assets, analysts can understand how much of a company’s resources are financed through debt. A high debt ratio can indicate higher financial risk. The formula is:
Real-World Example: A Simplified Balance Sheet
Let’s look at a simplified balance sheet for a fictional company, Innovate Corp., as of December 31, 2024.
Innovate Corp. Balance Sheet
Assets Side
Current Assets:
- Cash: $50,000
- Accounts Receivable: $30,000
- Inventory: $70,000
- Total Current Assets: $150,000
Non-Current Assets:
- Property, Plant & Equipment: $200,000
- Goodwill: $50,000
- Total Non-Current Assets: $250,000
TOTAL ASSETS: 250,000 = $400,000
Liabilities & Equity Side Liabilities:
- Accounts Payable: $40,000
- Long-Term Debt: $160,000
- Total Liabilities: $200,000
Shareholder’s Equity:
- Common Stock: $100,000
- Retained Earnings: $100,000
- Total Equity: $200,000
TOTAL LIABILITIES & EQUITY: 200,000 = $400,000
As you can see, Total Assets (400,000) perfectly balances with Total Liabilities & Equity (400,000).