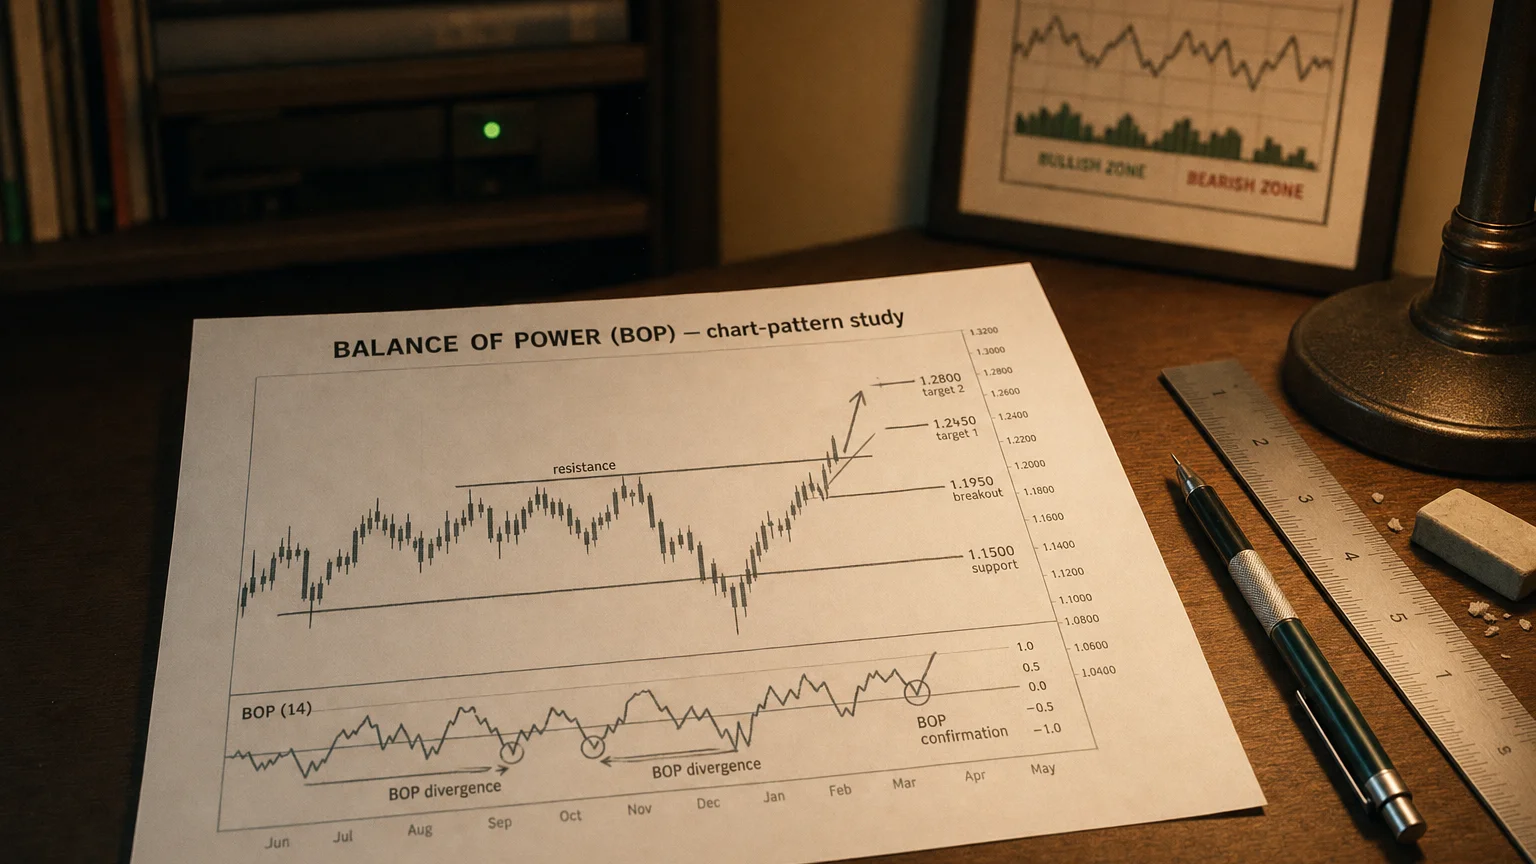
Balance of Power (BOP) calculates (Close - Open) / (High - Low) each bar, then smooths the result. Values near +1 indicate strong buying pressure; values near -1 indicate strong selling pressure. Divergences between BOP and price often precede reversals.
There is nothing new on Wall Street or in stock speculation. What has happened in the past will happen again and again.

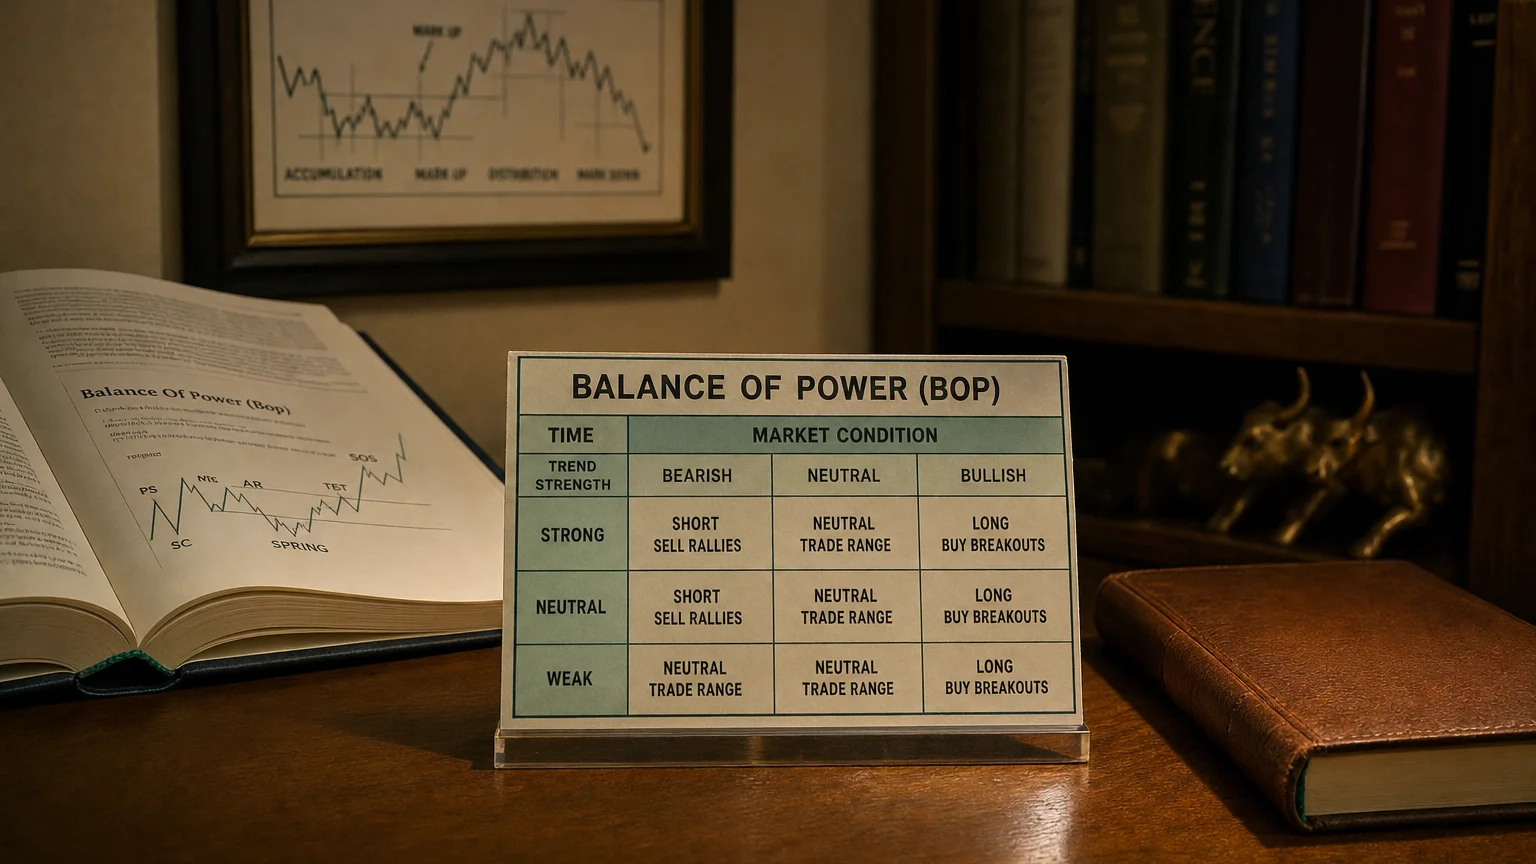
The Balance of Power (BOP) Indicator is a technical analysis tool developed by Igor Livshin to measure the strength of buyers vs. sellers in the market over a specific period. Unlike traditional momentum or volume indicators, BOP focuses on the relationship between opening and closing prices relative to a trading range. It’s designed to uncover underlying accumulation or distribution patterns that are often missed by price action alone.
Formula
(Formula — visualization pending)
-
The output is typically smoothed using a moving average (e.g., 14-period).
-
Values oscillate between +1 and -1.
Note: In most platforms, this calculation is normalized and smoothed automatically to reduce noise.
Interpretation
| BOP Value | Market Interpretation |
|---|---|
| +1 to +0.5 | Strong buying pressure (bullish control) |
| 0 to +0.5 | Mild to moderate accumulation |
| 0 to –0.5 | Mild to moderate distribution |
| –0.5 to –1 | Strong selling pressure (bearish control) |
| Crossing Zero | Potential shift in power between bulls and bears |
-
Sustained positive BOP values = institutional buying or smart-money accumulation.
-
Sustained negative BOP values = distribution phase, possibly before a breakdown.
Strategic Use Cases
-
Trend Confirmation
- Confirms price trends by identifying whether buying/selling pressure is aligned with the price move.
-
Early Reversal Detection
- A divergence between BOP and price may indicate a weakening trend or a reversal setup.
-
Breakout Validation
- BOP strength can help validate breakouts from consolidation ranges or chart patterns.
-
Hidden Accumulation/Distribution
- Detects stealth moves by institutional players before volume confirms.
Professional Applications
-
Equity Screening: Identify stocks under stealth accumulation before breakouts.
-
Momentum Models: Add as a factor in quantitative momentum filters.
-
Risk Management: Helps determine if recent price action is sustainable or speculative.
-
Intraday Trading: Useful in shorter timeframes when assessing power shifts within candlestick structures.
Limitations
-
Volatility sensitive: Extreme price moves can distort BOP briefly.
-
Low-volume stocks: May generate false readings due to erratic price action.
-
Not standalone: Should be used alongside volume, trend, or momentum indicators for optimal decision-making.
Summary
The Balance of Power (BOP) Indicator is a high-signal tool that isolates who is in control — buyers or sellers — during a given period. By focusing on the relationship between intraday price points, BOP reveals hidden power dynamics, making it invaluable for confirming trends, spotting reversals, and identifying institutional behavior in the market. When integrated into a larger trading or investment strategy, it provides sharp tactical insight into market pressure—with the precision elite traders demand.
Q · 01What does the Balance of Power (BOP) indicator measure?+
Q · 02How is the Balance of Power indicator calculated?+
Q · 03What does a BOP divergence signal?+
Q · 04What are the limitations of the BOP indicator?+