
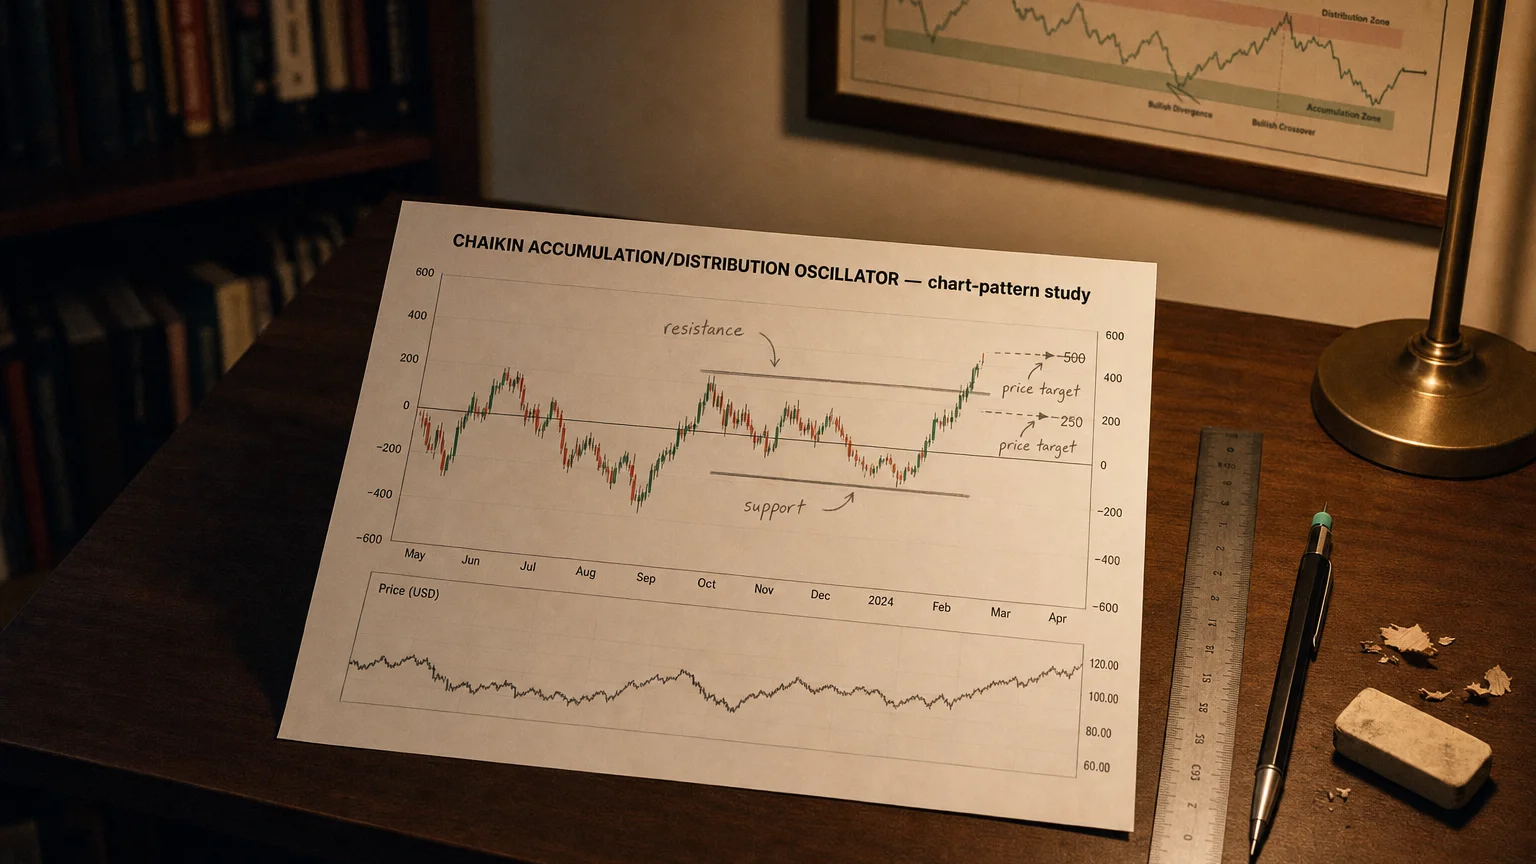
The Chaikin Accumulation/Distribution Oscillator subtracts a 10-period EMA from a 3-period EMA of the A/D Line to measure momentum in buying or selling pressure. Positive values signal accelerating accumulation; negative values indicate intensifying distribution.
The goal of a successful trader is to make the best trades. Money is secondary.

The Chaikin Accumulation/Distribution Line (Chaikin A/D Line) is a technical analysis indicator developed by Marc Chaikin. It combines both price movement and volume to assess the cumulative flow of money into and out of a security. The indicator is designed to identify whether a stock is under accumulation (buying pressure) or distribution (selling pressure).
Key Components
- Money Flow Multiplier:
This is a value between -1 and +1 that reflects where the closing price falls within the high-low range of a period.
(Formula — visualization pending)
- Money Flow Volume:
This multiplies the Money Flow Multiplier by the period’s volume:
(Formula — visualization pending)
- Chaikin A/D Line Calculation:
The line is a cumulative total of the Money Flow Volume over time:
(Formula — visualization pending)
Interpretation
-
An upward sloping Chaikin A/D Line suggests accumulation, where buying pressure is stronger.
-
A downward sloping line indicates distribution, or stronger selling pressure.
-
If the A/D Line diverges from the price trend (e.g., price rises while A/D Line falls), it may signal a potential reversal or weakening trend.
Uses
-
Trend Confirmation: Helps confirm the strength of a price trend by showing whether volume supports the movement.
-
Divergence Analysis: Traders watch for divergence between the A/D Line and price to spot possible reversals.
-
Volume-Based Insight: Offers more depth than price-only indicators by incorporating volume into the analysis.
Limitations
-
Like all volume-based indicators, it can give false signals in thinly traded or highly volatile securities.
-
It assumes the closing price reflects the direction of the trading session, which may not always be accurate in markets with frequent gaps or irregular volume patterns.
Summary
The Chaikin A/D Line is a versatile tool that combines price and volume to help traders evaluate buying and selling pressure. While it is most effective when used with other indicators or chart patterns, it provides valuable insights into market sentiment and potential trend strength.
Q · 01How is the Chaikin Oscillator calculated?+
Q · 02What does a zero-line cross signal on the Chaikin Oscillator?+
Q · 03What is the best way to use Chaikin Oscillator divergence?+