is a financial concept covered in this article. The Market's 'Not So Fast!' Signal
The goal of a successful trader is to make the best trades. Money is secondary.

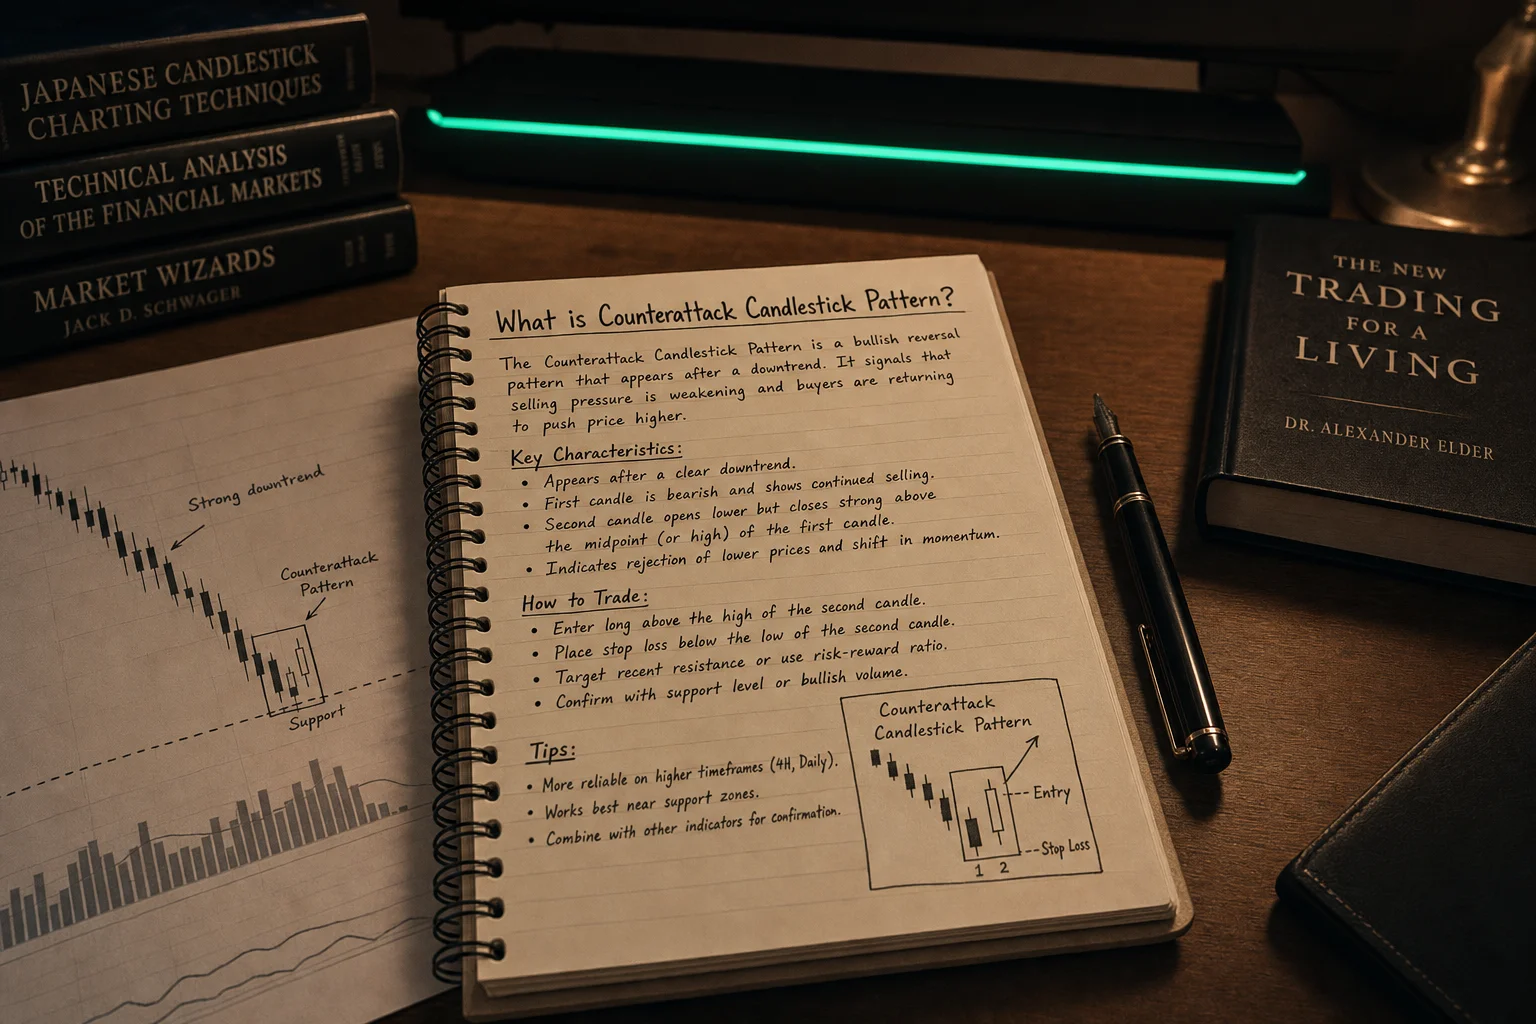
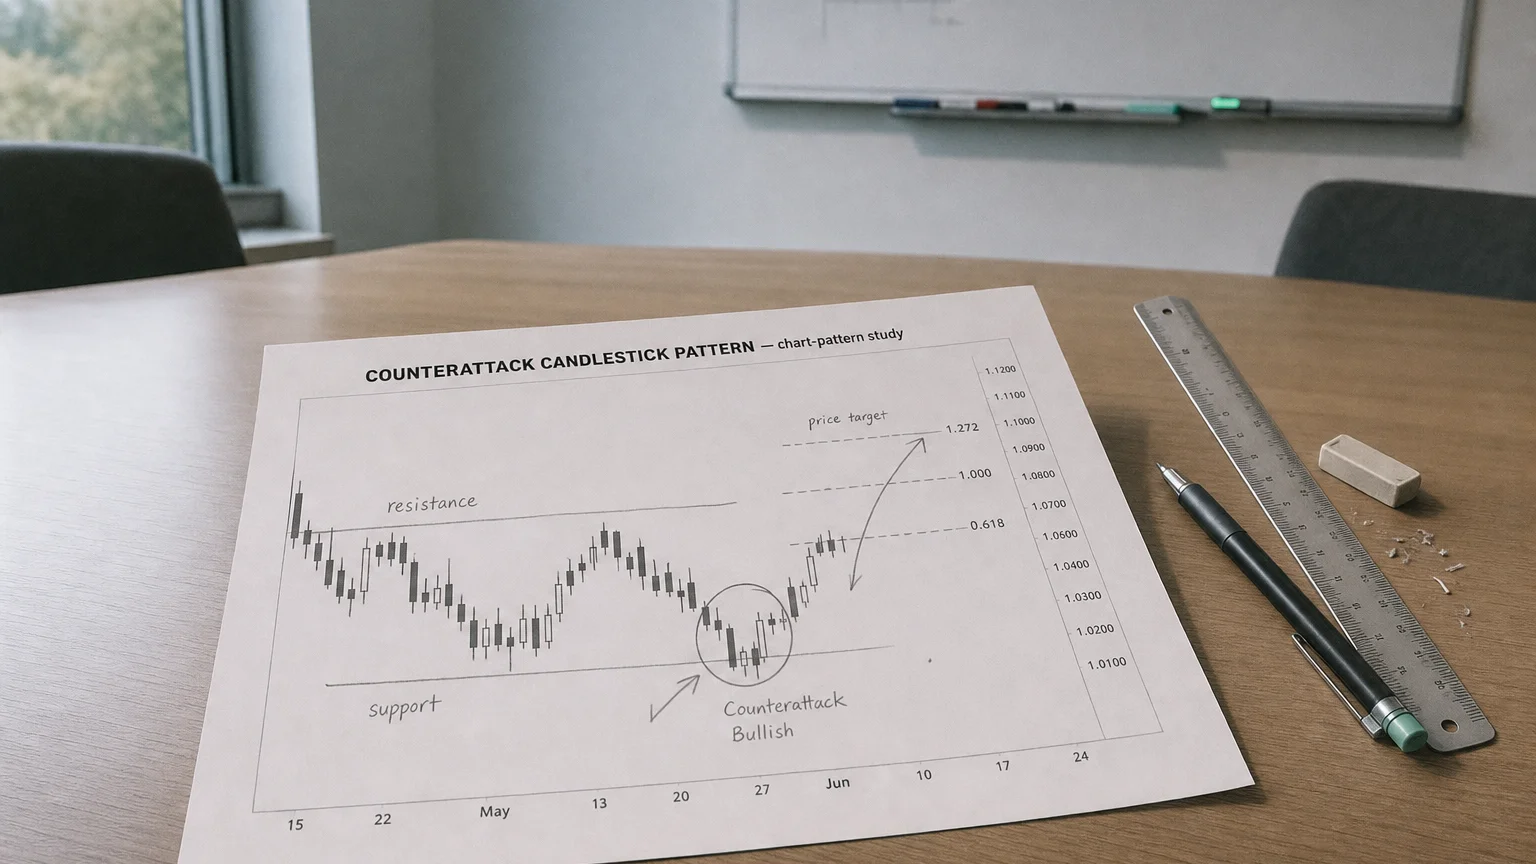
The Counterattack Pattern is a two-candle reversal pattern that forms after a strong directional move — either up or down — and signals an immediate challenge to trend momentum. It tells us that after a decisive push by one side (bulls or bears), the opposing side stepped in forcefully, closing the session at or near the same price level as the previous day.
This is a classic “not so fast!” moment on the chart — and it often precedes a momentum shift or at least a significant pullback.
Structure of the Counterattack Pattern
There are two main types:
Bullish Counterattack (after a downtrend)
-
First Candle: A strong bearish candle with a wide range and clear downward momentum.
-
Second Candle: A bullish candle that opens lower (gap down), but closes at or near the previous day’s close, matching it price-for-price.
The bulls absorb the bear pressure and drive price right back up to the prior close. Momentum shifts.
Bearish Counterattack (after an uptrend)
-
First Candle: A strong bullish candle — price pushes upward aggressively.
-
Second Candle: A bearish candle that opens higher (gap up), but closes back down to the prior close, erasing gains.
The bears strike back hard, saying “Not today, bulls.”
Interpretation & Market Psychology
| Element | Interpretation |
|---|---|
| Gap at open | Attempt to continue the trend (momentum push) |
| Matching close | Opposing side neutralizes the momentum |
| Second candle reversal | First sign that the trend is weakening or stalling |
| Perfect near-close match | Adds strength and confidence to the signal |
This pattern is a market momentum clash — two sessions, two sides, and a draw on the close, but a win for the challenger.
Strategic Use Cases
-
Reversal Entry Setup
- Perfect for entering early reversals or fade setups after an extended move.
-
Confirmation With Oscillators
- Combine with RSI, MACD, or stochastic divergence for high-confidence plays.
-
Tactical Stop Loss Adjustment
- Use the pattern to tighten stops on a fading trend — especially if trading continuation setups.
-
Volatility Filters
- When paired with ATR or volume spikes, it can signal a short-term turning point with force.
Professional Applications
-
Swing Trading Triggers: Works well on daily charts for trend exhaustion detection.
-
Pattern Recognition Algorithms: Used in momentum-to-reversal signal generators.
-
Quantitative Signal Modeling: Ideal for defining two-bar reversal logic in algorithmic systems.
-
Portfolio Rotation Tools: Helps flag sectors or names where directional bias may flip.
Limitations
-
Needs confirmation: Best followed by a third candle in the direction of the reversal.
-
Not standalone: Use with trendlines, moving averages, or volume context.
-
Less effective in sideways markets: Works best after clear directional pushes.
Summary for Traders & Tactical Analysts
The Counterattack Pattern is a two-candle power struggle where the second candle neutralizes the first and signals a battle for control. Whether bullish or bearish, this pattern delivers sharp, decisive clues that a reversal or major stall is in play. It’s subtle, strong, and battle-tested for spotting momentum pivots when the market shows its hand.
Q · 01What is Counterattack?+