How this two-candle pattern signals a sharp sentiment shift and a potential market bottom.
The goal of a successful trader is to make the best trades. Money is secondary.

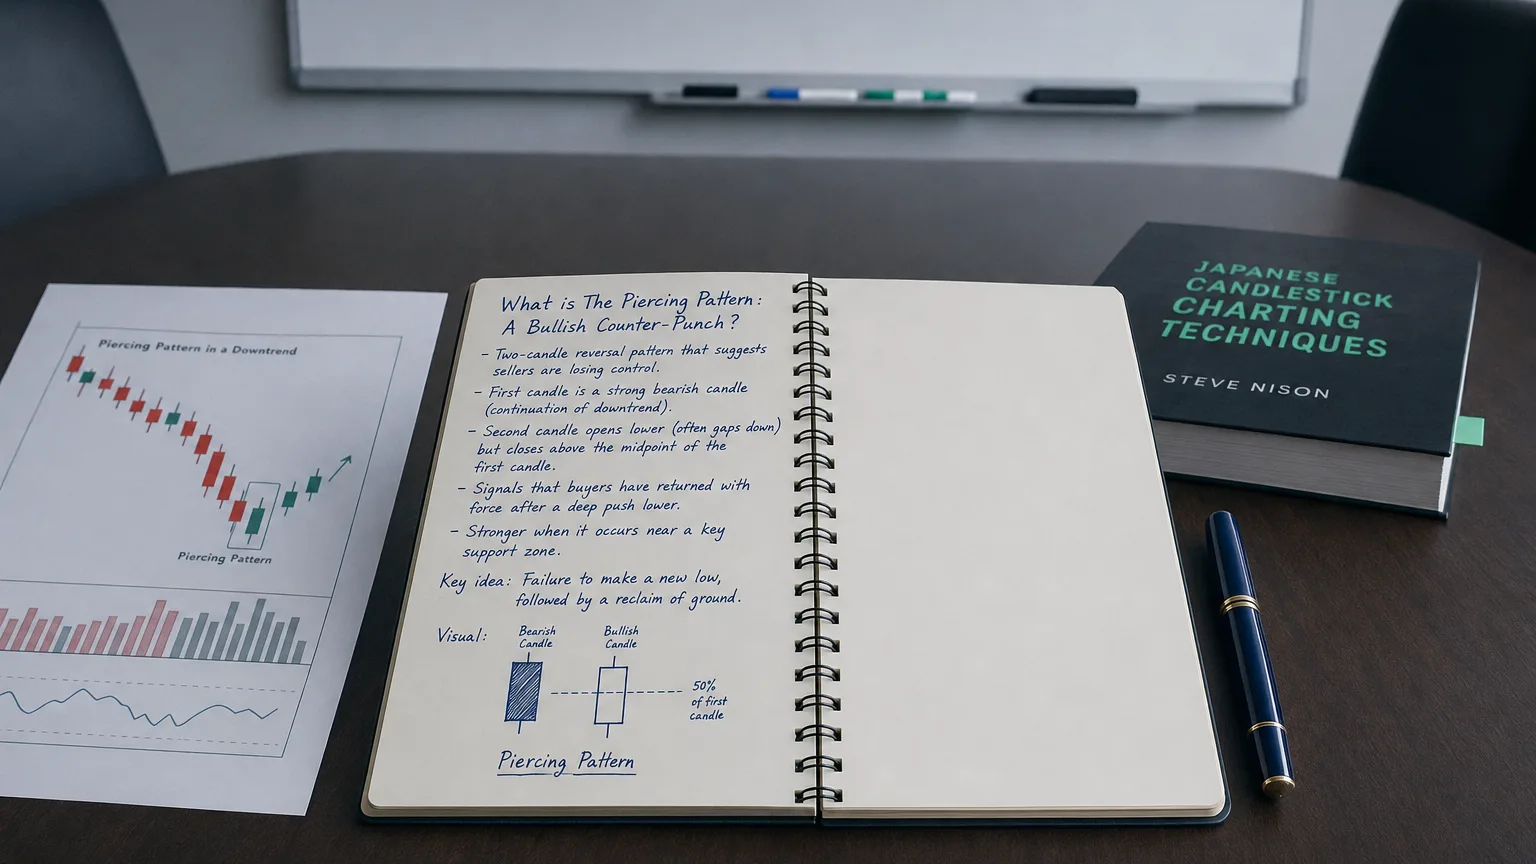
The Piercing Pattern (a.k.a. Piercing Line) is a two-candle bullish-reversal formation that appears after a decline. Candle 1 is a long bearish bar that closes near its low; Candle 2 gaps lower on the open, then rallies to close above the midpoint of Candle 1’s real body (but below its open). The upward “pierce” into the prior body signals that buyers have abruptly wrested back half the ground lost the day before.
Recognition checklist
| Rule | Specification | Why it matters |
|---|---|---|
| Trend | Clearly down into the pattern | Seeks to reverse weakness |
| Candle 1 | Long red/black body, closes near low | Bears in full control |
| Gap | Candle 2 opens below Candle 1’s low | Bears press again at the open |
| Pierce level | Candle 2 close ≥ 50 % of Candle 1 body, < Candle 1 open | Shows bulls reclaimed majority share |
| Volume filter (optional) | ≥ 1.2 × 20-day average on Candle 2 | Confirms committed buying |
Market psychology
-
Capitulation (C-1): shorts feel secure after a decisive down day.
-
Bear trap attempt (gap-down open): sellers push again, but demand appears.
-
Power punch (C-2): aggressive buying forces price to “pierce” the prior body’s midpoint, flipping intraday sentiment and leaving late bears exposed for a squeeze.
Trading playbook
| Element | Aggressive | Conservative |
|---|---|---|
| Entry | Buy at/near Candle 2 close if volume surges | Buy only after next candle closes above Candle 2 high |
| Initial stop | Under the pattern’s low or ATR(14)×1 | Same |
| Targets | 1.5–3 R, first resistance / 20-EMA, or measured-move of C-1 | Same; trail at +1 R |
| Time filter | Trim if price fails to move ≥ 0.5 R in 3-5 bars | — |
| Edge boosters | Oversold RSI divergence; pattern printed near a weekly support or Fib cluster | Same |
Statistical tendencies
| Study | Sample | Bullish follow-through | Notes |
|---|---|---|---|
| Bulkowski (US stocks, 4.7 M candles) | 1 404 signals | ≈ 64 % upward breakout success | Ranks 21 / 103 patterns for reversal reliability |
| TrendSpider back-test (SPY 1994-2024) | 240 signals | 0.86 profit factor (10-bar hold) with volume > avg | Underperforms without volume filter |
Take-away: raw edge is solid but improves when Candle 2 volume expands and the close is well above the 50 % threshold.
Strengths
-
Objective two-bar rules—scanner friendly.
-
Provides tight risk (stop just below pattern low).
-
Shows up more often than Morning Star or Morning Doji Star, giving more opportunities.
Limitations & pitfalls
-
Fails ~ 1⁄3 of the time—confirmation or volume filter is key.
-
Works poorly if Candle 1 is small (little ground to pierce).
-
News gaps can negate setup overnight; always check macro / earnings calendar.
Quick visual cheat-sheet
-
⬇️ Down-trend
-
🟥 Long red candle (close near low)
-
↙ gap-down open
-
🟩 Long green candle
-
close ≥ 50 % of prior body
-
✅ Buy on confirmation; stop under pattern low
Summary
The Piercing Pattern is a two-candle “counter-punch” that shows bulls reclaiming at least half of yesterday’s sell-off with a forceful gap-down-and-rally. Trade it only when Candle 2 closes past the 50 % mark (preferably on strong volume), set a surgical stop beneath the combined low, and aim for 1.5–3 R or the next resistance shelf. Add momentum or support confluence for extra edge, and you’ve got a disciplined, repeatable trigger for catching early upside reversals while keeping risk tight. Rock on and trade smart!