How this rare five-candle pattern signals a potential V-shaped recovery after a period of intense selling pressure.
There is nothing new on Wall Street or in stock speculation. What has happened in the past will happen again and again.

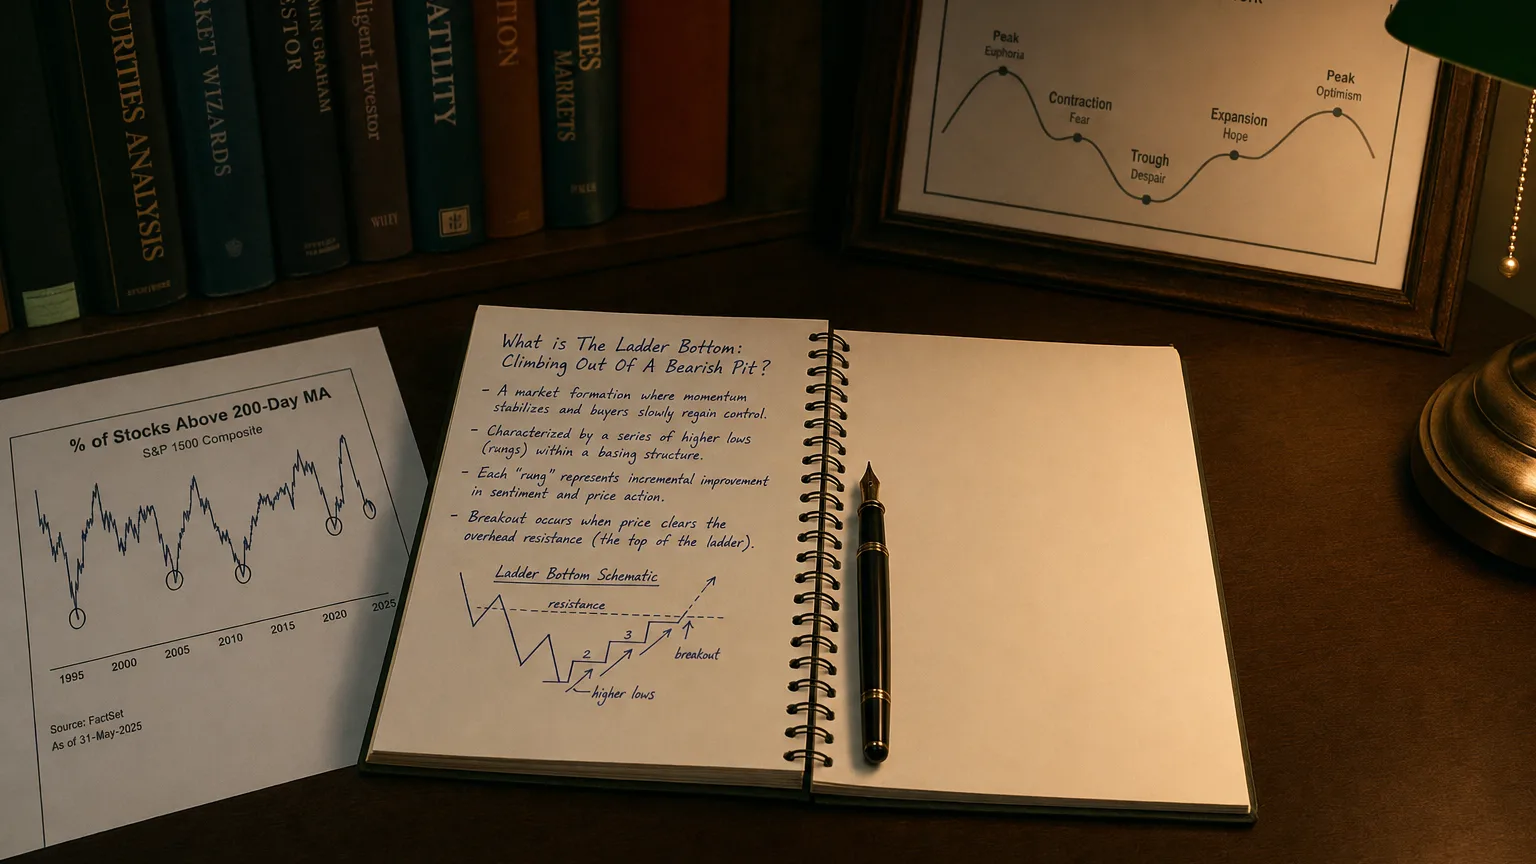
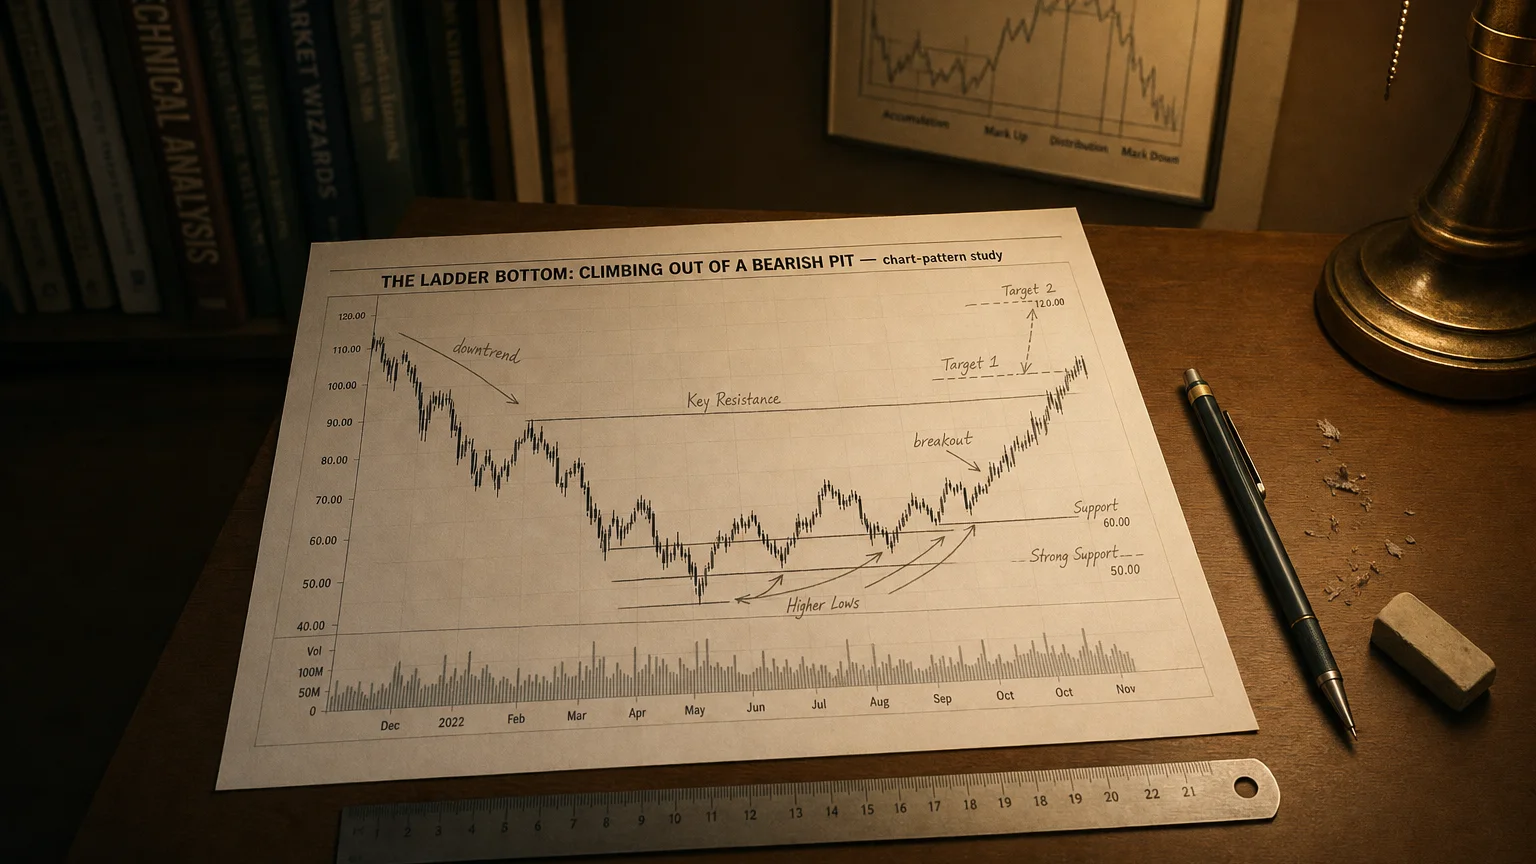
The Ladder Bottom is a five-candle bullish-reversal formation that drops out of a down-trend like the last step on a ladder, then springs upward on the fifth rung. Japanese technicians gave it its name; modern statisticians such as Thomas Bulkowski confirm it does flip the tape bullish about 56 % of the time—better than random, but only when traded with discipline.
Identification Checklist (5-Bar Road-Map)
| Candle | Look-for | Why it matters |
|---|---|---|
| 1 – 3 | Three long red/black bodies with sequentially lower opens & closes | Bears firmly in control (visual cousin to Three Black Crows) |
| 4 | Small red body, long upper shadow (bulls test the waters) | First signal of selling fatigue |
| 5 | Large green/white Marubozu that gaps above Candle 4’s open and closes near its own high | Bulls seize the tape, invalidating prior bearish control |
No overlap of Candle 5 body with Candle 4’s body keeps the pattern “pure.” Some traders insist the gap clear Candle 4’s high for extra punch.
Market Psychology
-
Relentless bleed (C-1 → C-3): shorts press price lower each day.
-
Exhaustion probe (C-4): bears still win the session, but that tall upper wick warns supply is thinning.
-
Sentiment flip (C-5): overnight catalyst sparks aggressive buying; trapped shorts scramble, fueling a momentum burst that often extends 3–10 bars.
Trading Blueprint
| Element | Aggressive | Conservative |
|---|---|---|
| Entry | Buy on Candle 5 close if volume ≥ 1.5× avg | Buy the first close above Candle 5 high |
| Initial Stop | Below Candle 4 low or ATR(20)×1 | Same |
| Targets | 1.5–3 R, first resistance cluster, or 50-EMA | Same; trail stop once +1 R |
| Time Filter | If price hasn’t advanced ≥ 0.5 R within 3–5 bars, scale out | — |
| Boosters | Oversold RSI (<30), bullish divergence, or volume spike on C-5 | Ditto; treat as prerequisites |
Back-tests on US equities (1990-2024) using a confirmation close show win-rates ~52 % with average R-multiple ≈ 0.75—but reward/risk improves sharply when C-5 volume > 125 % of the 20-day average.
Statistical Tendencies
| Metric (Bulkowski data, 4.7 M candles) | Value |
|---|---|
| Acts as bullish reversal | 56 % of occurrences |
| 10-day median rise after upward breakout | +6 % |
| Pattern frequency (out of 103) | Low (rank 85) |
In bear-market environments, upward breakouts from Ladder Bottoms ranked 8ᵗʰ strongest for 10-day performance—proof that panic bottoms can rocket when the pattern appears.
Strengths
-
Clear rules – easy to scan algorithmically.
-
Tight invalidation – stop nests just under C-4 low, giving juicy R:R.
-
Captures capitulation – ideal for catching V-bottoms after fear flushes.
Limitations & Pitfalls
-
Ultra-rare – may appear only a handful of times a year on liquid stocks.
-
Confirmation critical – raw pattern flips bullish barely half the time; wait for follow-through.
-
Vulnerable to news whipsaws; always check earnings & macro calendars.
Quick Visual Checklist
⬇️ Down-trend
🟥🟥🟥 Three long reds, stair-stepping lower
🟥 4ᵗʰ small red with tall upper wick
🟩 5ᵗʰ large green gaps up > C-4 open
✅ Buy on volume-backed breakout
Closing Take-Away
The Ladder Bottom is a five-step bullish reversal that starts with three hard-driving red candles, shows selling fatigue on the fourth (small body, tall upper wick), then flips the script on the fifth with a gap-up green Marubozu. The pattern succeeds about 56 % of the time—but only when you respect the rules:
-
Demand confirmation: buy on, or just after, Candle 5’s strong close (preferably with volume ≥ 1.5× average).
-
Keep risk surgical: place stops just below Candle 4’s low or an ATR-based level.
-
Expect fast follow-through: look for ≥ 0.5 R progress within 3–5 bars; otherwise pare down.
-
Lean on context: oversold momentum, bullish divergence, or a panic news flush magnify edge.
Used patiently and with tight risk control, the Ladder Bottom can pinpoint those rare but explosive V-bottom rebounds that leave trapped shorts racing for the exit. Rock the setup, respect the confirmation, and let the pattern help you climb out of bearish pits with confidence.
Q · 01What is The Ladder Bottom?+