Moving Average Convergence / Divergence (MACD) Indicator
A comprehensive guide to the MACD indicator, a dynamic tool that combines trend and momentum to provide powerful trading signals.

Overview
A comprehensive guide to the MACD indicator, a dynamic tool that combines trend and momentum to provide powerful trading signals.
The Moving Average Convergence / Divergence (MACD) Indicator is a versatile and widely used technical indicator that transforms two exponential moving averages (EMAs) into a momentum oscillator. This powerful combination allows traders to gauge both the direction and the strength of a market trend in one compact package. By understanding the interplay between its components, you can unlock a deeper understanding of market dynamics and make more informed trading decisions.
What is the Moving Average Convergence Divergence (MACD)?
The MACD indicator operates on the principle of convergence and divergence between a fast and a slow exponential moving average (EMA). When the fast EMA moves toward the slow EMA, it signals that momentum is fading (convergence). Conversely, when the fast EMA pulls away from the slow EMA, it indicates that momentum is expanding (divergence). This dynamic provides a clear visual representation of the market's underlying strength and potential for trend continuation or reversal.
The primary advantage of the MACD is its ability to reveal both the direction and the intensity of a trend simultaneously.
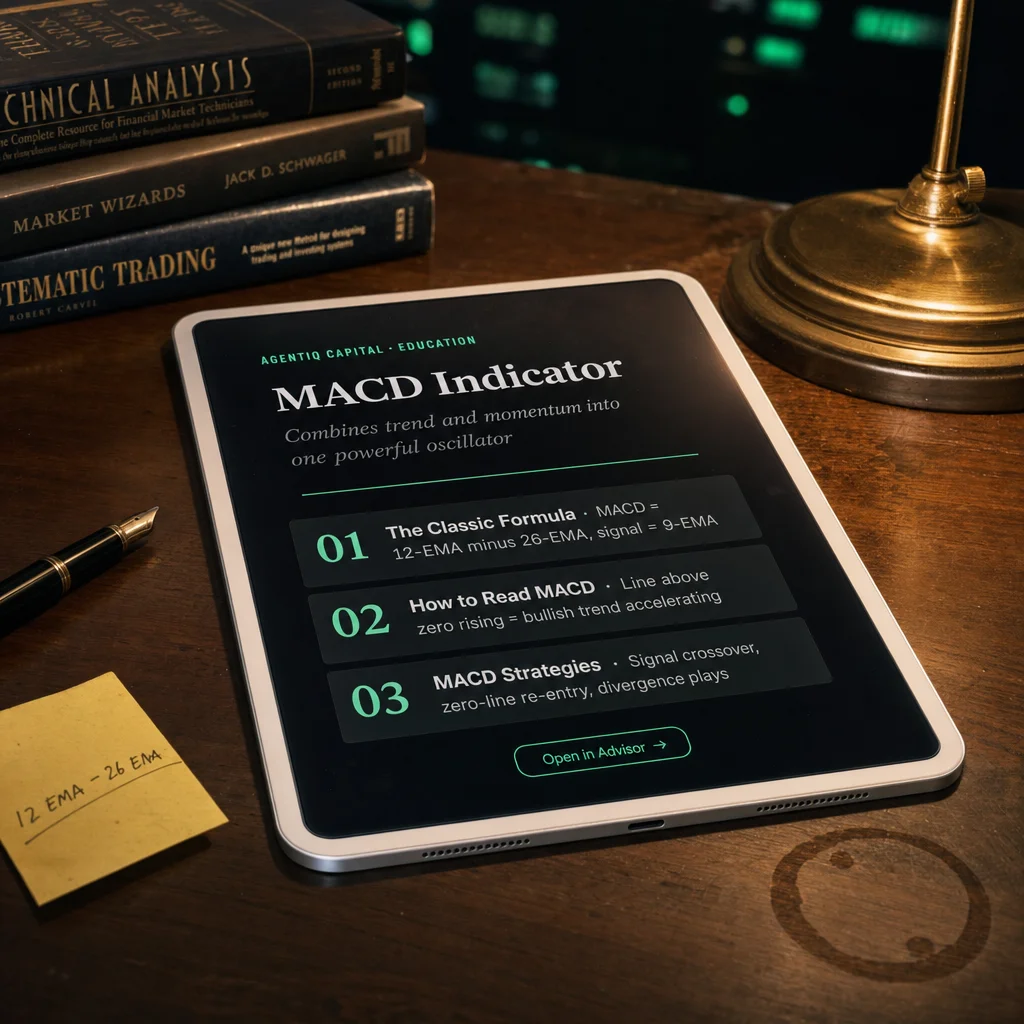
The Classic MACD Formula
The MACD indicator is comprised of the following components, with the standard setting of 12-26-9:
- Fast EMA: The 12-period Exponential Moving Average.
- Slow EMA: The 26-period Exponential Moving Average.
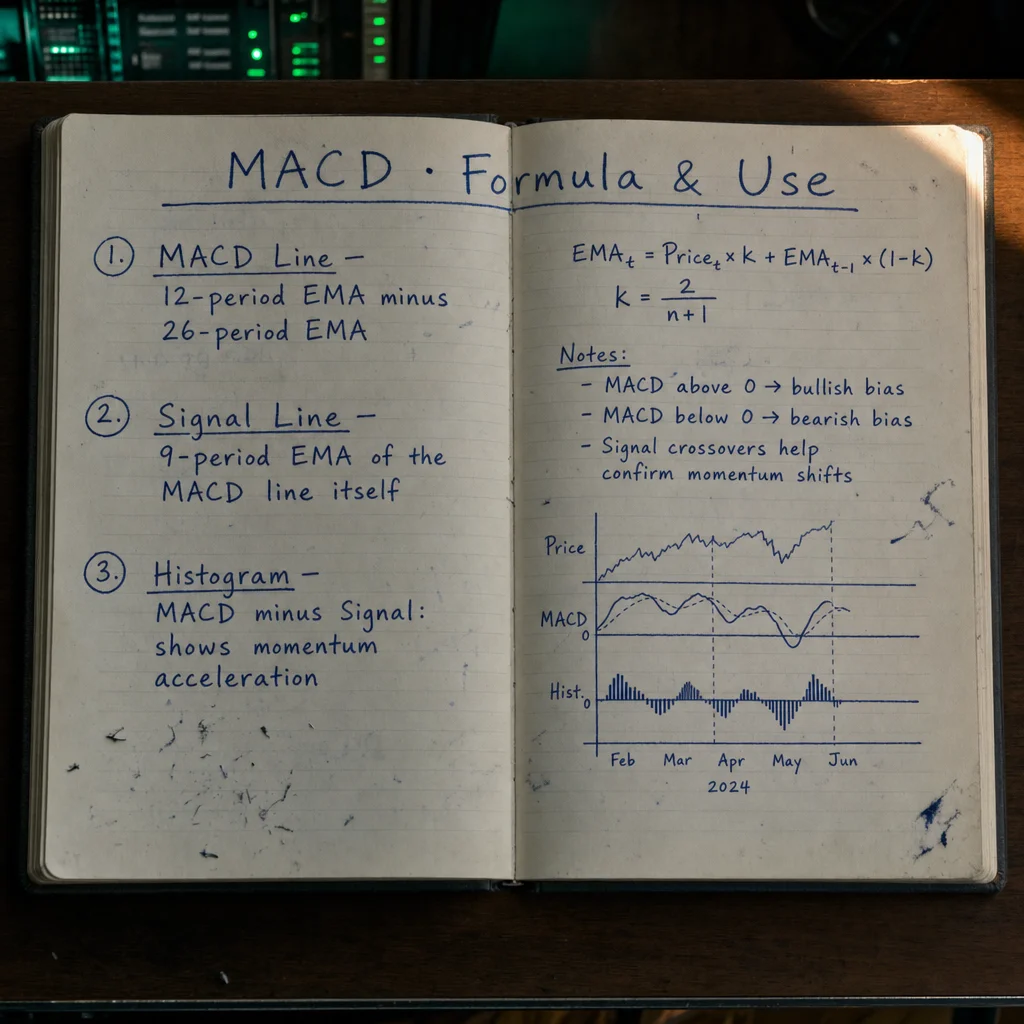
- MACD Line: The result of subtracting the 26-period EMA from the 12-period EMA.
- Signal Line: A 9-period EMA of the MACD line itself.
- Histogram: The difference between the MACD line and the Signal line, plotted as a bar chart that oscillates around a zero line.
Formula:
Formula:
Formula:
"The technician believes that anything that can possibly affect the price—fundamentally, politically, psychologically, or otherwise—is actually reflected in the price of that market."
— John J. Murphy, Former Director of Technical Analysis at Merrill Lynch, CMT Association founder Technical Analysis of the Financial Markets: A Comprehensive Guide to Trading Methods and Applications, Prentice Hall / New York Institute of Finance, 1999, Chapter 1 ("The Philosophy of Technical Analysis"), p. 2 (1999)
How to Read the MACD Indicator
Understanding the visual cues of the MACD can provide actionable insights:
| Visual Cue | Market Meaning | Typical Plays |
|---|---|---|
| MACD line above zero & rising | Up-trend gaining steam | Ride longs, trail under swing lows |
| MACD line below zero & falling | Down-trend accelerating | Favor shorts or stay flat |
| MACD crosses above Signal | Bullish momentum shift | Entry trigger if price confirms |
| MACD crosses below Signal | Bearish shift | Exit longs / consider shorts |
| Histogram peaks then shrinks | Trend fatigue | Tighten stops, watch for reversal |
| Price makes higher high, MACD fails (bearish divergence) | Underlying weakness | Look for sell setups |
| Price makes lower low, MACD rises (bullish divergence) | Hidden accumulation | Prep for bounce |
Understanding MACD Parameter Tweaks
While the 12-26-9 setting is standard, it can be adjusted to suit different trading styles and market conditions:
| Setting | Effect | When to Use |
|---|---|---|
| Shorter pair (e.g., 5-13-5) | Faster, more responsive | Day-trading, scalps |
| Longer pair (e.g., 20-50-10) | Smoother, fewer signals | Position trading, weekly charts |
| Apply to Heikin-Ashi or HL2 | Extra noise filtering | Volatile crypto / FX crosses |
For a balanced indicator, aim to keep the fast-to-slow EMA ratio at approximately 1:2.
Favorite MACD Strategies
Signal-Line Crossover
A popular strategy is to go long when the MACD line crosses up through the Signal line while both are above the zero line. Conversely, a trader might flip short when the MACD crosses down through the Signal line while both are below zero. To increase the reliability of this strategy, it's often filtered with a longer-term trend indicator, such as only taking long signals when the 200-period Simple Moving Average is sloping upwards.
Zero-Line Re-Entry
In an established uptrend, a trader can wait for the MACD to dip near the zero line and then hook back up. This indicates a pullback is likely over, providing a buying opportunity. The same logic can be applied in reverse for short entries in a downtrend.
Divergence + Price Action
This advanced strategy involves spotting bullish or bearish divergence and then waiting for confirmation from price action, such as a break of a trendline, a bullish or bearish engulfing candle, or a significant spike in volume.
Strengths and Landmines of MACD
| Strengths | Limitations |
|---|---|
| Combines trend and momentum in one comprehensive view | Averages can lag in fast reversals |
| Works on any asset and timeframe | Generates whipsaws in sideways or choppy markets |
| Histogram visualizes acceleration and deceleration clearly | Divergences can stretch on trending runaway markets |
| Divergences can provide early warnings of potential trend reversals |
To mitigate the risk of false signals, consider using the MACD in conjunction with other indicators like ATR bands or Keltner channels to filter out noise.
Implementation Checklist
- Define Your Objective: Your trading style (e.g., swing trading vs. scalping) will determine the optimal MACD settings.
- Back-test: Test crossover and divergence rules on your chosen instrument to understand their effectiveness.
- Seek Confluence: Combine MACD signals with other forms of analysis, such as higher-timeframe trends, support and resistance levels, and volume.
- Set Alerts: Use your trading platform's alert features to notify you of key MACD events like signal line crossovers, zero-line hooks, and histogram flips.
- Quarterly Tune-Up: Periodically review and adjust your MACD settings to adapt to changes in market volatility.