Woodie's Pivot Points Formula, Levels, and How Traders Use
Pivot Points Woodie explained: definition, formula, key examples, and how investors interpret this concept in financial analysis and reporting.
Overview
Pivot Points Woodie explained: definition, formula, key examples, and how investors interpret this concept in financial analysis and reporting.
What Are Woodie's Pivot Points?
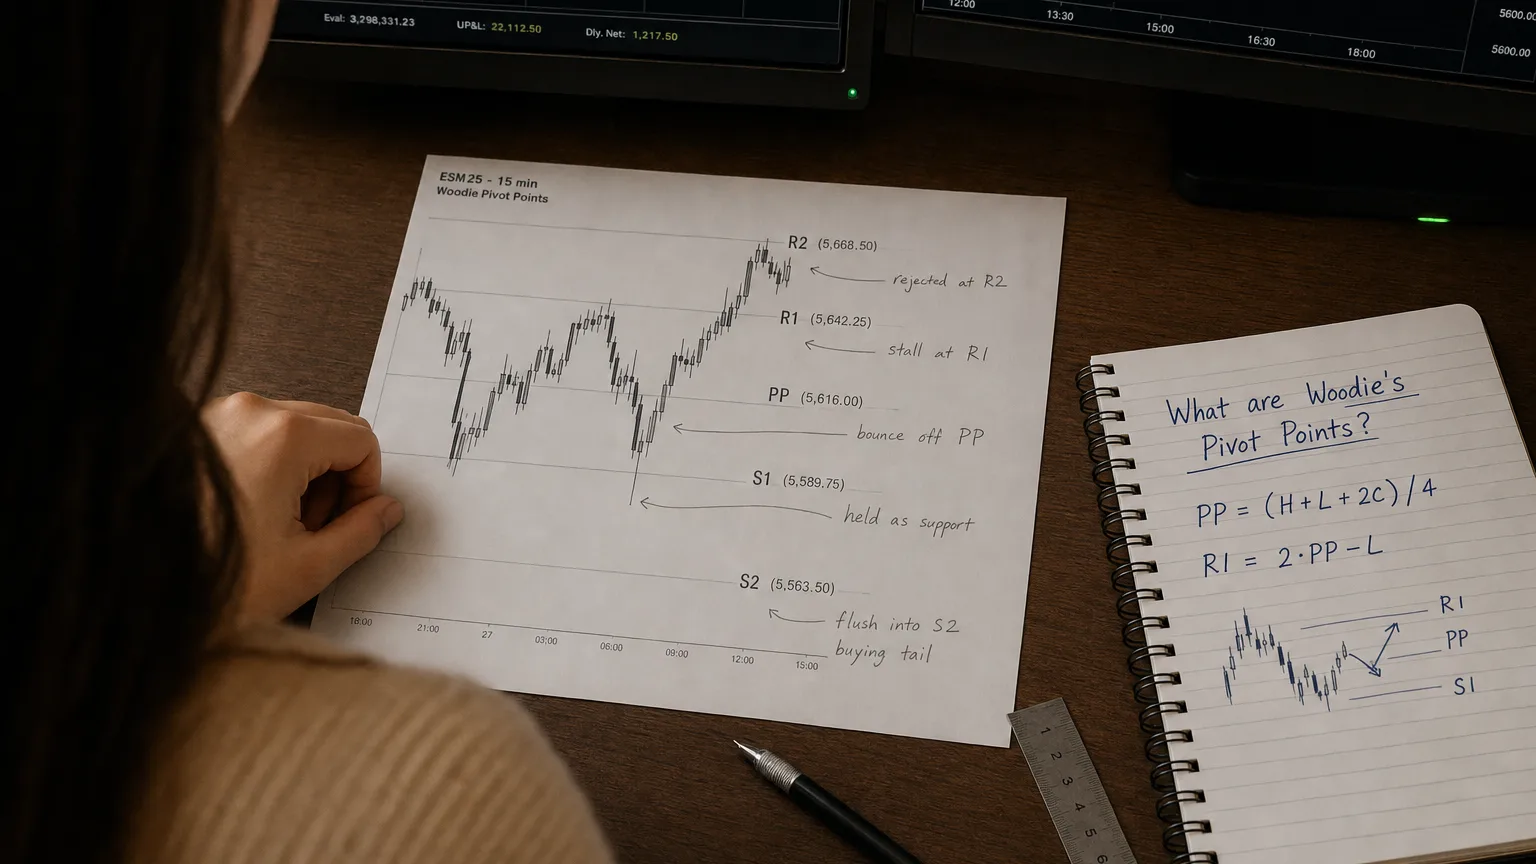
Woodie's Pivot Points are a technical analysis tool used to identify potential support and resistance levels for the upcoming trading session. Developed by trader Ken Woodie, the method modifies the classic pivot point formula by placing twice the weight on the previous session's closing price.
The core idea: the closing price reflects the final consensus of buyers and sellers, making it more meaningful than the session's high or low.
"There is nothing new on Wall Street or in stock speculation. What has happened in the past will happen again and again."
— Jesse Livermore, Legendary Stock Trader Reminiscences of a Stock Operator (1923)
The Woodie Formula
| Level | Formula |
|---|---|
| Pivot (PP) | (High + Low + 2 × Close) ÷ 4 |
| Resistance 1 (R1) | (2 × PP) − Low |
| Resistance 2 (R2) | PP + High − Low |
| Support 1 (S1) | (2 × PP) − High |
| Support 2 (S2) | PP − High + Low |
Compare with the Classic Pivot: PP = (High + Low + Close) ÷ 3. The Woodie PP will always be pulled toward the close relative to Classic.

Classic vs Woodie — Key Differences
| Feature | Classic | Woodie |
|---|---|---|
| Pivot formula | (H + L + C) ÷ 3 | (H + L + 2C) ÷ 4 |
| Close weighting | Equal to H and L | Double |
| Bias | Mid-range | Close-oriented |
| Best for | Trending sessions | Sessions with decisive closes |
How Traders Use Woodie Pivot Points
1. Directional Bias
If price opens above the Woodie PP, the session bias is bullish. Traders look for long entries near PP or S1 with targets at R1 and R2.
If price opens below the Woodie PP, the bias is bearish. Short entries near PP with targets at S1 and S2.
2. Breakout Trading
A clean break and hold above R1 (especially on rising volume) signals continuation toward R2. Similarly, a break below S1 with volume targets S2.
3. Reversal Signals
Price that rallies to R1 or R2 and reverses with a rejection candle may offer a mean-reversion short. The same applies at S1/S2 for long reversals.

Limitations
- Woodie pivots are lagging by nature — they use the previous session's data
- Less effective in low-volatility environments where price clusters near the pivot
- Should be combined with volume analysis and trend context for best results
Frequently Asked Questions
What are Woodie's Pivot Points?
Woodie's Pivot Points are a variation of classic pivot points that assign double weight to the previous session's closing price in the pivot calculation.
How do you calculate Woodie's Pivot Point?
The Woodie Pivot = (High + Low + 2 × Close) ÷ 4.
What is the difference between Woodie and Classic Pivot Points?
Classic pivots weight High, Low, and Close equally. Woodie pivots double-weight the Close.
How do traders use Woodie Pivot Points?
Traders use the Woodie Pivot as a central reference for directional bias and trade entries at key S/R levels.