Rate of Change Percentage (ROC %) is a financial concept covered in this article.
The elements of good trading are: cutting losses, cutting losses, and cutting losses. If you can follow these three rules, you may have a chance.
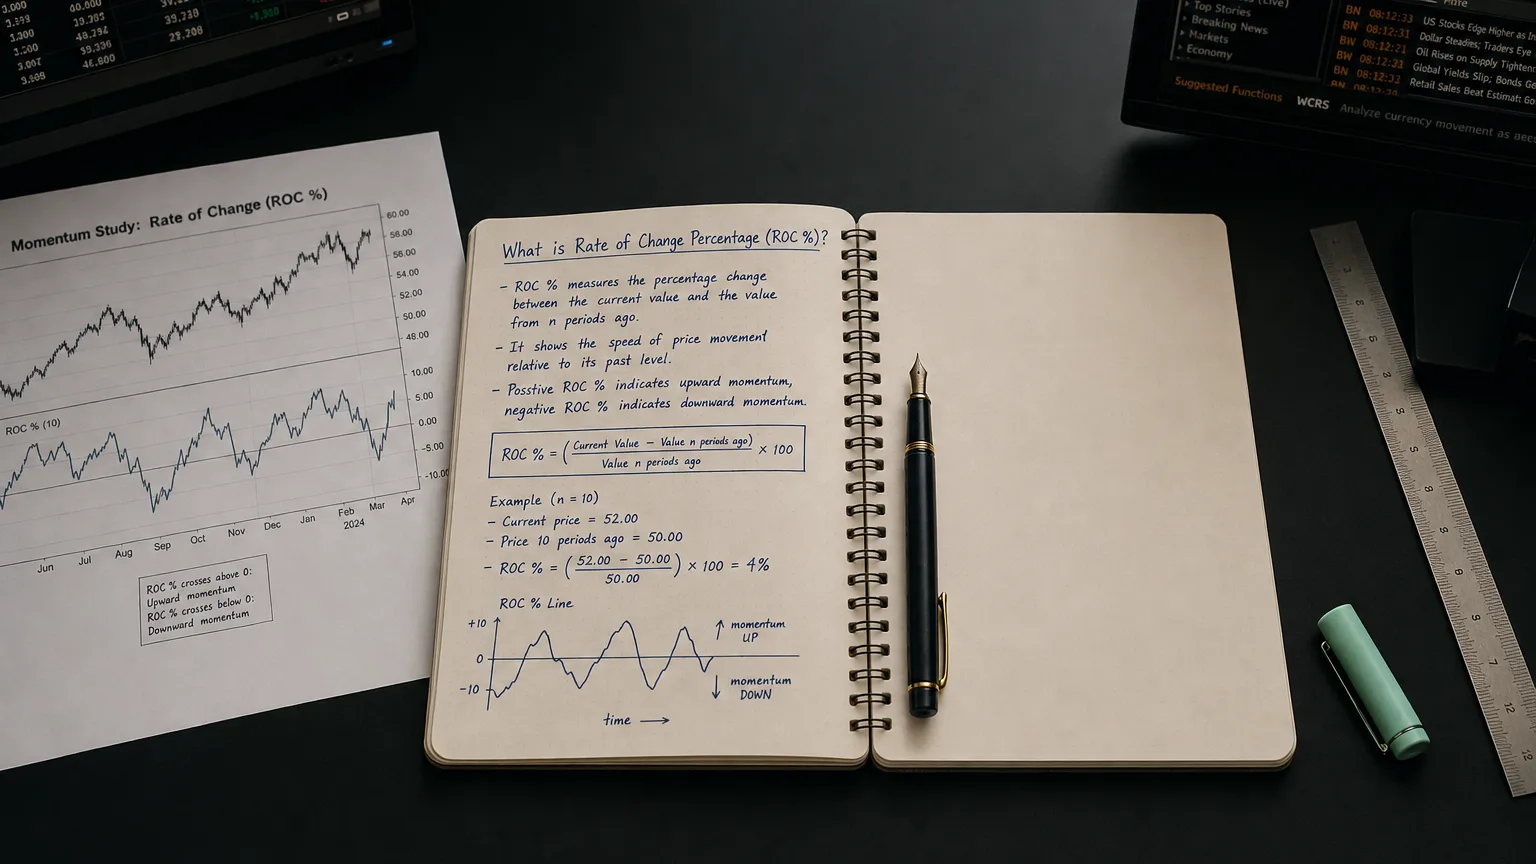
The Rate of Change Percentage (ROC %) is the momentum indicator’s polite cousin – it measures how much price has changed over N periods, but expresses it as a percentage of the older price. This normalization makes it perfect for comparing momentum across different assets, timeframes, or volatility levels. No more ‘big stock = big raw moves’ bias. It’s the clean, scale-invariant way to spot acceleration, divergences, and over-extension – a staple for multi-asset traders and anyone who wants fair momentum reads.
The Formula – Percentage Power
Clean and normalized:
ROC% = \left( \frac{P_t}{P_{t-N}} - 1 \right) \times 100
Where P is usually close price, N is look-back.
+10% = price 10% higher than N bars ago → bullish momentum. −5% = 5% lower → bearish. Zero = no net change.
Unlike raw Momentum, scale is consistent – +10% means the same relative move on a 1000 stock.
“The elements of good trading are: cutting losses, cutting losses, and cutting losses. If you can follow these three rules, you may have a chance.”
— Ed Seykota, Pioneering systematic trend-following trader Market Wizards: Interviews with Top Traders, Jack D. Schwager (New York Institute of Finance, 1989), chapter “Ed Seykota — Everybody Gets What They Want” (1989)
Reading the Percentage Oscillator
Key signals:
- Cross above zero: Price gaining ground – bullish shift.
- Cross below zero: Losing ground – bearish pressure.
- High positive extremes: Strong upward momentum – potential overbought.
- Deep negative extremes: Strong downside – potential oversold.
- Divergence: Price new high + lower ROC peak → weakening bulls.
Thresholds vary by asset – backtest historical percentiles for overbought/oversold.
Parameter Choices
N tunes sensitivity:
- Short (5–12): Fast signals – intraday/scalping, more noise.
- Classic (12–20): Balanced daily swings – most common.
- Longer (30–50): Smoother macro view – position trades.
Pro Trading Setups
Effective plays:
- Zero-line momentum: ROC >0 + price > MA → long bias confirmed.
- Extreme reversal: ROC < −15% + bullish candle → oversold bounce candidate.
- Divergence trade: Bearish divergence + ROC crossing zero down → short setup.
- Multi-asset scan: Rank symbols by ROC % – highest = strongest relative momentum.
Great for relative strength – compare ROC across sector stocks to find leaders.
Smart Combinations
Pair for edge:
- Trend filter: Only positive ROC in uptrends (price > 200-MA).
- Volume: ROC surge + volume spike = real conviction.
- Support/Resistance: Zero cross at key level = stronger signal.
- RSI/MACD: Combine for divergence confirmation.
Strengths and Realistic Limits
The Wins
- Percentage scale – directly comparable across assets/timeframes.
- Clean momentum measure – zero lag on close.
- Excellent for relative strength and divergence spotting.
The Gotchas
- Whipsaws in ranges – multiple zero crosses.
- Extreme readings can persist in trends.
- No volume context – add separately.
Your ROC % Checklist
- Start with 12–20 period classic.
- Define extreme thresholds per asset (backtest percentiles).
- Add trend and volume filters.
- Use for multi-symbol ranking and scans.
- Watch divergences and zero crosses closely.
- Adjust N when volatility regime shifts.