
Rate of Change Ratio (ROCR) is a financial concept covered in this article. The Multiplicative Momentum Measure That Stays Positive
Whenever I enter a position, I have a predetermined stop. That is the only way I can sleep. I know where I'm getting out before I get in.
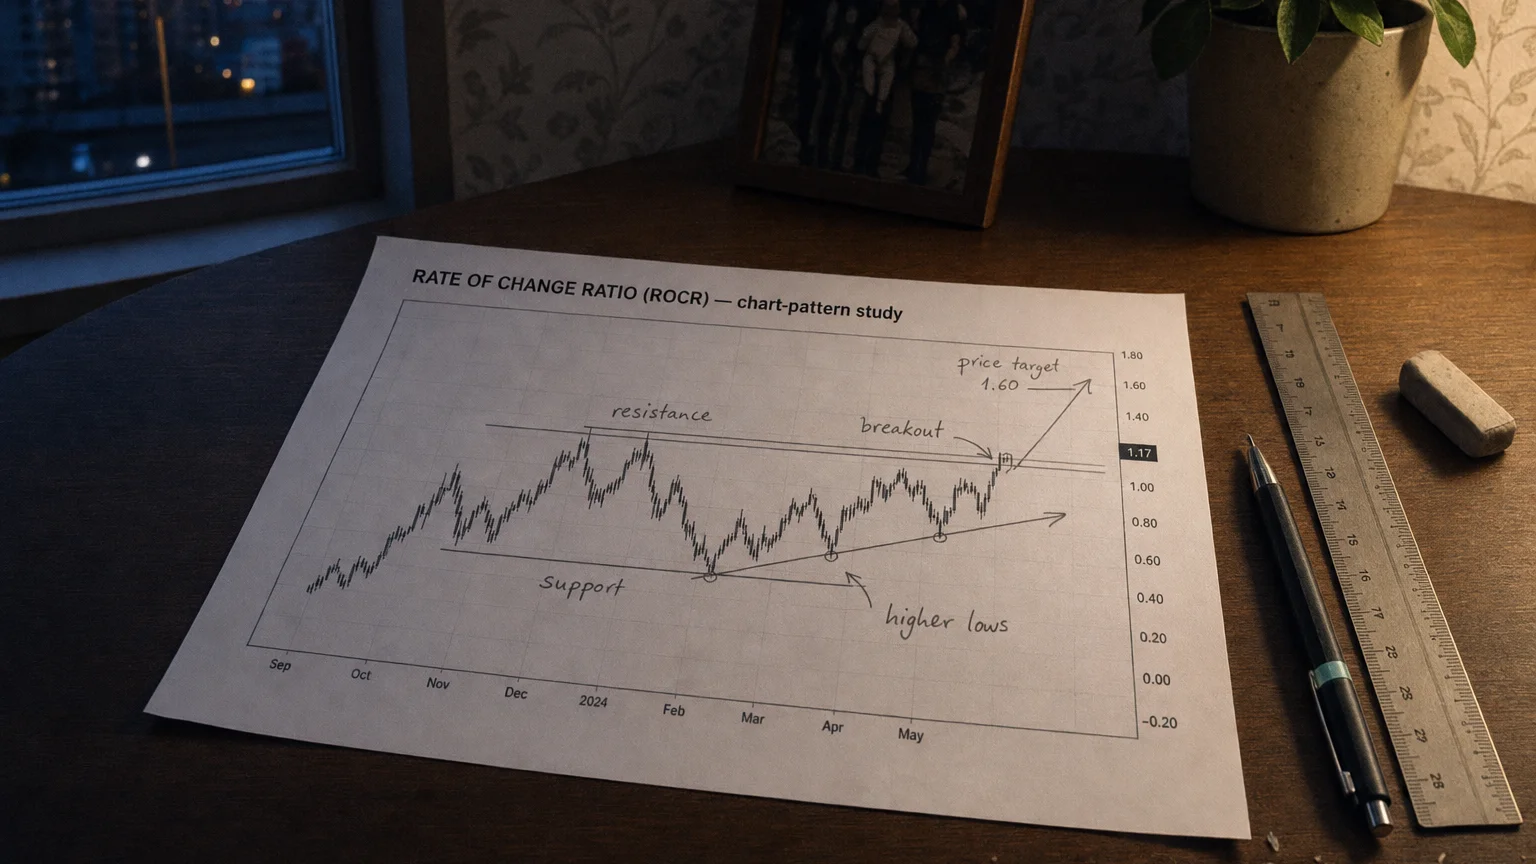
The Rate of Change Ratio (ROCR) is the momentum family’s clever ratio twist: it divides today’s price by the price N periods ago, giving a clean multiplier instead of a difference or percentage. Always positive and centered around 1.0, it tells you how many times ‘bigger’ (or smaller) current price is compared to the past. Above 1 = price higher (bullish momentum), below 1 = lower (bearish). It’s the scale-friendly, ratio-based way to gauge momentum strength – especially handy for comparing assets with wildly different price levels or building multiplicative strategies.
The Formula – Simple Ratio Power
Straightforward:
ROCR = \frac{P_t}{P_{t-N}}
Where P is usually close price.
- >1.0: Price higher than N ago – bullish momentum.
- =1.0: No net change.
- <1.0: Price lower – bearish momentum.
- 1.15: Price 15% higher (same as +15% ROC).
Mathematically linked to ROC %: ROCR = 1 + (ROC%/100)
“Whenever I enter a position, I have a predetermined stop. That is the only way I can sleep. I know where I’m getting out before I get in.”
— Bruce Kovner, Hedge fund trader, founder of Caxton Associates Market Wizards: Interviews with Top Traders, Jack D. Schwager (New York Institute of Finance, 1989), chapter “Bruce Kovner — The World Trader” (1989)
Reading the Ratio Oscillator
Key signals:
- Cross above 1.0: Momentum turning bullish.
- Cross below 1.0: Momentum turning bearish.
- High above 1: Strong upward thrust (e.g., 1.20 = +20%).
- Deep below 1: Strong downside (e.g., 0.85 = –15%).
- Divergence: Price new high + lower ROCR peak → fading strength.
Always positive scale makes extremes intuitive in ratio terms.
Parameter Choices
N controls sensitivity:
- Short (5–12): Quick reactions – intraday and volatile assets.
- Medium (14–20): Balanced daily swings.
- Longer (30–50): Smoother for position trades and macro views.
Pro Trading Setups
Effective plays:
- 1.0 line momentum: ROCR >1.0 + price > MA → bullish confirmation.
- Extreme deviation: ROCR >1.20 in uptrend → strong, consider adding; <0.85 → potential oversold bounce.
- Divergence: Bearish divergence + ROCR crossing below 1 → short signal.
- Relative strength: Rank assets by ROCR – highest ratios = momentum leaders.
Ratio nature shines in cross-asset comparisons – same scale for penny stocks and blue chips.
Smart Combinations
Pair for edge:
- Trend filter: Only act above 1.0 in uptrends.
- Volume: ROCR surge + volume increase = real move.
- Support/Resistance: 1.0 cross at key level = stronger signal.
- Log-scale charts: ROCR aligns perfectly with multiplicative price action.
Strengths and Realistic Limits
The Wins
- Positive ratio scale – intuitive and comparable across assets.
- Clean multiplicative view – matches how prices really compound.
- Great for relative strength ranking and divergence.
- Zero lag on close.
The Gotchas
- Whipsaws around 1.0 in ranges.
- Extremes can persist in strong trends.
- No volume context built-in.
Your ROCR Checklist
- Start with 12–20 period.
- Define extreme thresholds via backtesting.
- Add trend and volume filters.
- Use for multi-asset momentum scans.
- Watch 1.0 crosses and divergences.
- Adjust N with changing volatility.
Q · 01What is Rate Of Change Ratio?+