How this rare two-candle continuation pattern signals a powerful rejection of a counter-trend move.
The goal of a successful trader is to make the best trades. Money is secondary.

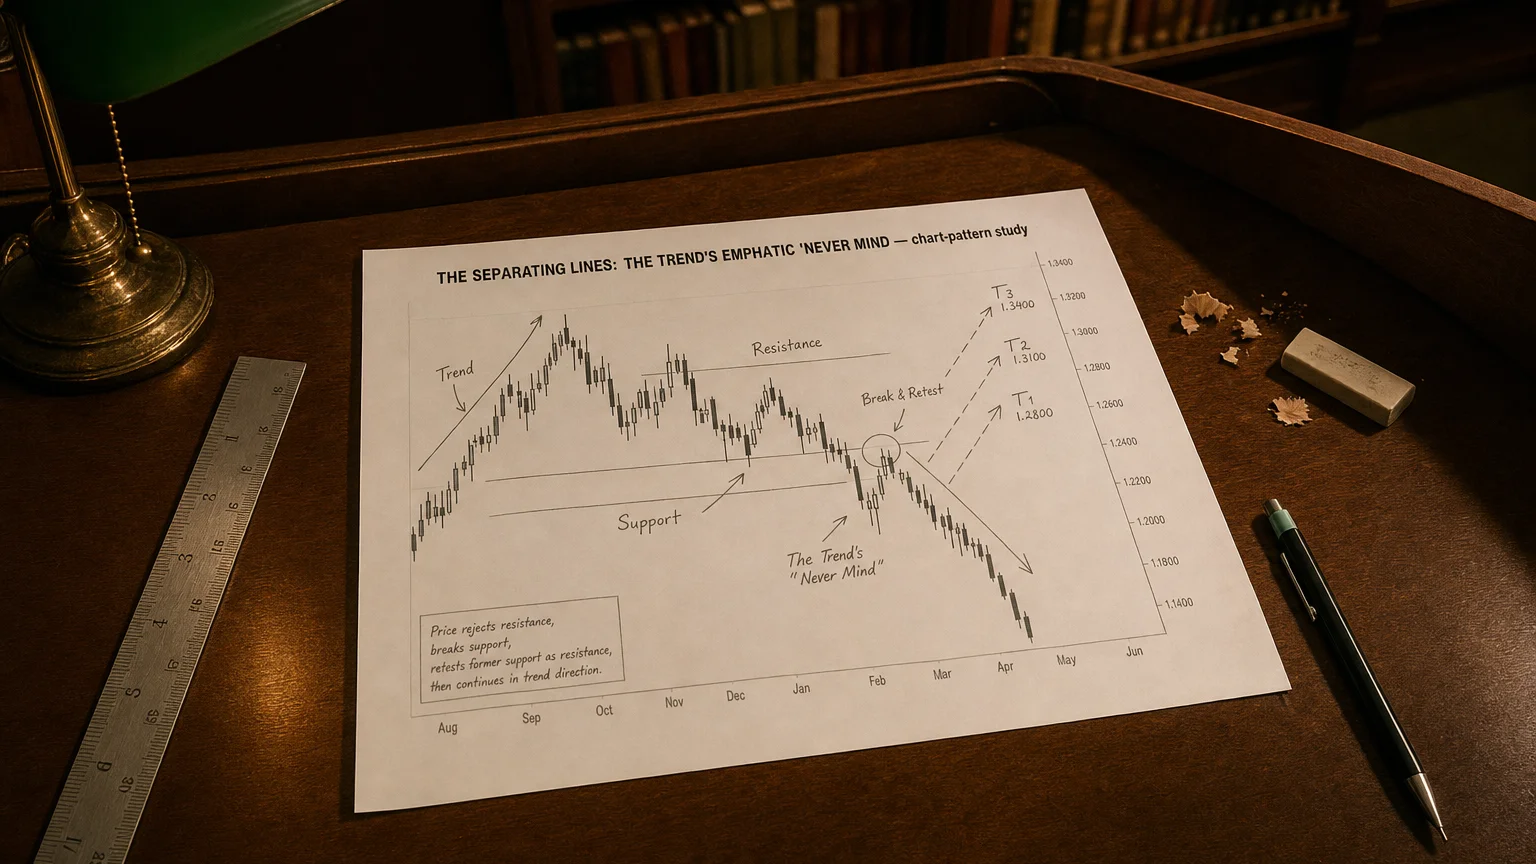
A Separating Lines pattern is a two-candle continuation signal in which the second candle opens exactly at the first candle’s open and then drives price hard in the direction of the underlying trend.
-
Bullish Separating Lines (rising market):
1️⃣ Long black/red candle, closing near its low.
2️⃣ Next day gaps up to the prior open, then finishes as a long white/green candle that closes near the high. -
Bearish Separating Lines (falling market):
1️⃣ Long white/green candle, closing near its high.
2️⃣ Next day gaps down to the prior open, then sells off into a long black/red candle.
The identical opens are the “separating line,” declaring that the counter-trend reaction was rejected and the original trend has resumed.
Identification checklist
| Rule | Bullish spec | Bearish spec | Why it matters |
|---|---|---|---|
| Trend | Clear advance | Clear decline | A continuation, not reversal |
| Candle #1 | Long bearish body | Long bullish body | Temporary counter-move |
| Gap | Opens at Candle 1 open (↑) | Opens at Candle 1 open (↓) | Negates prior day’s move |
| Candle #2 | Long bullish Marubozu-type close near high | Long bearish Marubozu-type close near low | Shows dominant side back in control |
| Shadows | Ideally small | Same | Emphasises momentum |
Market psychology
-
Counter-punch: Candle 1 looks like a possible reversal day.
-
“Reset” open: Next session begins right where Candle 1 began, erasing that hope.
-
Sweep: Dominant players press all session, forcing late counter-trend traders to cover and providing fuel for a renewed run.
Trading blueprint
| Element | Long setup (bull pattern) | Short setup (bear pattern) |
|---|---|---|
| Entry | Buy on/just after Candle 2 close or break above its high | Sell/short on/just after Candle 2 close or break below its low |
| Initial stop | Below Candle 1 low or 1× ATR(14) | Above Candle 1 high or 1× ATR(14) |
| Targets | 1.5 – 3 R, prior swing high/resistance, or measured-move of Candle 1 | Mirror for shorts |
| Edge boosters | Volume ≥ 1.2× 20-day avg on Candle 2; rising 20-EMA; higher-TF up-trend | Volume surge; falling 20-EMA; higher-TF down-trend |
| Time filter | If price fails to move ≥ 0.5 R within 3-5 bars, tighten/exit | Same |
Statistical tendencies
| Variant (Bulkowski 4.7 M US daily bars) | Continuation rate | Frequency rank* | Performance rank* |
|---|---|---|---|
| Bullish | 72 % up-side follow-through | 82 / 103 | 5 / 103 (top-tier) |
| Bearish | 63 % down-side follow-through | 82 / 103 | — (good but weaker) |
*Lower rank numbers = rarer; performance rank measures post-breakout move size.
Key takeaway: reliable but scarce—expect only a handful of prints per year on liquid symbols.
Strengths
-
High continuation reliability when rules met.
-
Crystal-clear invalidation: the shared open price.
-
Momentum acceleration often delivers a quick 1.5 – 3 R payoff.
Limitations & pitfalls
-
Ultra-rare; do not relax criteria to force trades.
-
Edge fades if Candle 2 range is small or volume light.
-
News gaps can distort “same open” requirement—double-check catalysts.
Quick visual cheat-sheet
-
Bullish pattern Bearish pattern
-
🟥 long down bar 🟩 long up bar
-
↑ gap to same open ↓ gap to same open
-
🟩 long up bar closes↑ 🟥 long down bar closes↓
-
Entry → close/high Entry → close/low
-
Stop → other side Stop → other side
Summary
The Separating Lines pattern is the market’s emphatic “never mind” after a one-day counter move: price re-opens at the prior day’s open, then barrels in the direction of the dominant trend. Trade it with:
-
Strict open-price match to guard purity.
-
Volume or trend filters to confirm real commitment.
-
Tight stops just beyond the first candle’s extreme, seeking a fast 1.5–3 R surge before momentum cools.
Respect those rules, and this rare two-candle signal can slot neatly into your trend-following arsenal—delivering sharp, low-risk entries when the crowd discovers yesterday’s hope was nothing but a false dawn. Rock on and manage that risk!
Q · 01What is The Separating Lines?+