Understanding the mechanics and surprising statistical behavior of this three-candle gap pattern.
There is nothing new on Wall Street or in stock speculation. What has happened in the past will happen again and again.

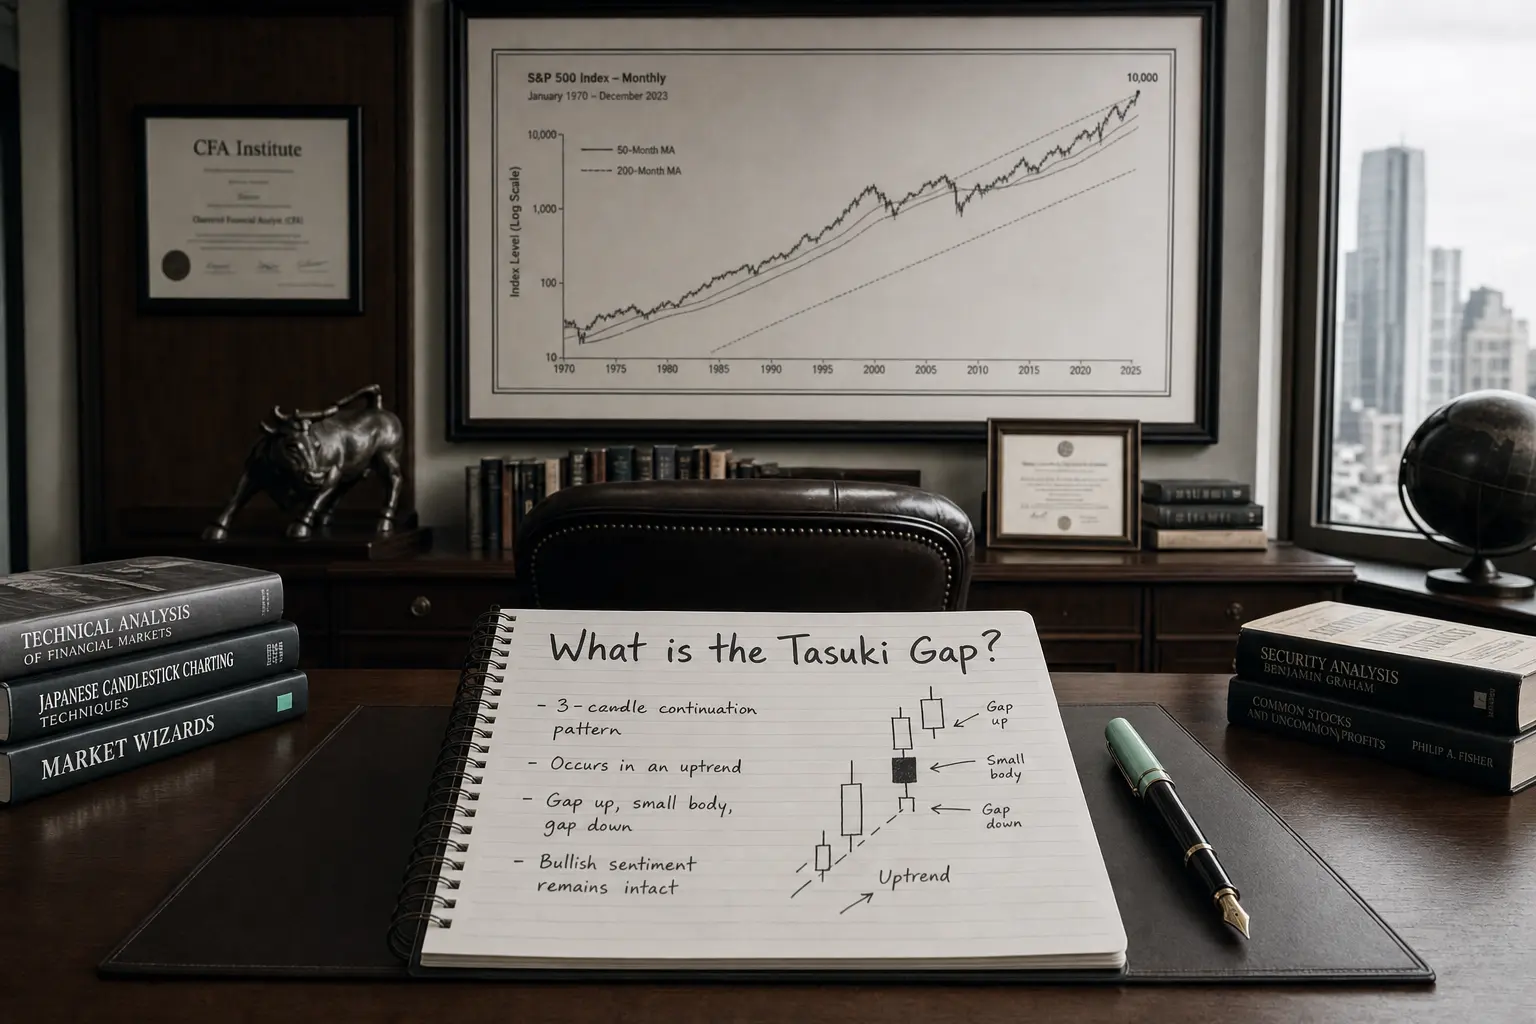
A Tasuki Gap (Japanese for “sash”) is a three-candle continuation pattern built around a true price gap:
| Variant | Candle #1 | Candle #2 | Candle #3 | Text-book bias |
|---|---|---|---|---|
| Upside (Bullish) Tasuki Gap | Long green body in an up-trend | Opens with an up-gap and closes green | Small red candle opens inside #2 body and closes inside the gap (but never fills it) | Continuation higher |
| Downside (Bearish) Tasuki Gap | Long red body in a down-trend | Opens with a down-gap and closes red | Small green candle opens inside #2 body and closes inside the gap | Continuation lower |
The unfilled gap is the story: bulls (or bears) refuse to surrender the real estate, signalling that the prevailing trend still has fuel.
Pattern rules & filters
-
Prevailing trend must be clear and active.
-
Gap direction matches the trend (up-gap in bulls, down-gap in bears).
-
Candle #3 colour flips (opposite of #1 & #2) and closes part-way into the gap without filling it.
-
Shadows are allowed; bodies carry the message.
-
A close that completely fills the gap invalidates the pattern.
Market psychology
-
Impulse & gap (#1 → #2) – dominant side presses hard, even leaps price over the prior close.
-
Counter-probe (#3) – the other side tries to reclaim ground but stalls before finishing the job; the gap remains.
-
Expectation – if later bars break in the gap-side direction, late counter-trend traders cover, fuelling continuation.
Trading blueprint
| Element | Bullish Tasuki set-up | Bearish Tasuki set-up |
|---|---|---|
| Entry | Buy on a close above Candle #2 high, or on the first bar that extends the up-gap | Sell/short on a close below Candle #2 low |
| Initial stop | Below Candle #3 low or midpoint of the gap | Above Candle #3 high or midpoint of the gap |
| Targets | 1.5–3 R, prior swing high, or measured move = height of gap | Mirror for shorts |
| Edge boosters | Volume ≥ 1.2× avg on breakout, rising 20-EMA, momentum confirmation | Volume surge, falling 20-EMA, RSI < 40 |
Because the gap defines a narrow risk unit (R), modest follow-through can deliver attractive R-multiples.
How well does it work? (Bulkowski 4.7 M-candle study)
| Pattern | “Text-book” view | Actual breakout direction | Frequency | Performance rank* |
|---|---|---|---|---|
| Upside Tasuki Gap | Bullish continuation | 57 % up (near random) | 74 / 103 | 5 / 103 – big moves when it breaks |
| Downside Tasuki Gap | Bearish continuation | 54 % up (acts as mild reversal) | 68 / 103 | 23 / 103 |
*Overall 10-day post-breakout performance.
Take-away: treat the pattern as a set-up, not a guarantee—confirmation matters.
Strengths
-
Clear geometry – easy to code and scan.
-
Tight, objective stops anchored to the gap.
-
When it works, post-breakout moves rank in the top decile for size.
Limitations & common pitfalls
-
Rare – especially with the strict “gap not filled” rule.
-
Raw continuation edge is only slightly above coin-flip; wait for a closing breakout.
-
Overnight news can erase or over-stretch the gap, voiding the signal.
Summary
The Tasuki Gap is a “mind-the-gap” continuation pattern: price leaps, pulls back just enough to scare weak hands, but refuses to surrender the gap. Trade it like a pro:
-
Insist on confirmation – enter only when price moves beyond Candle #2’s extreme in the trend’s direction.
-
Park your stop inside the gap; that surgical risk (R) lets even a modest extension bank 1.5–3 R.
-
Combine with volume, trend slope, or momentum filters to separate genuine follow-through from the 40 % that fake out.
Stick to those rules and the Tasuki Gap becomes a precise, low-risk tool for pyramiding an existing trend rather than a guessing game about where the next candle will land. Rock on and manage that risk!