Stochastic Oscillator is a financial concept covered in this article. The Classic Momentum Speedometer for Overbought and Oversold Zones
Technical analysis tracks the past; it does not predict the future. You have to use your own intelligence to draw conclusions.
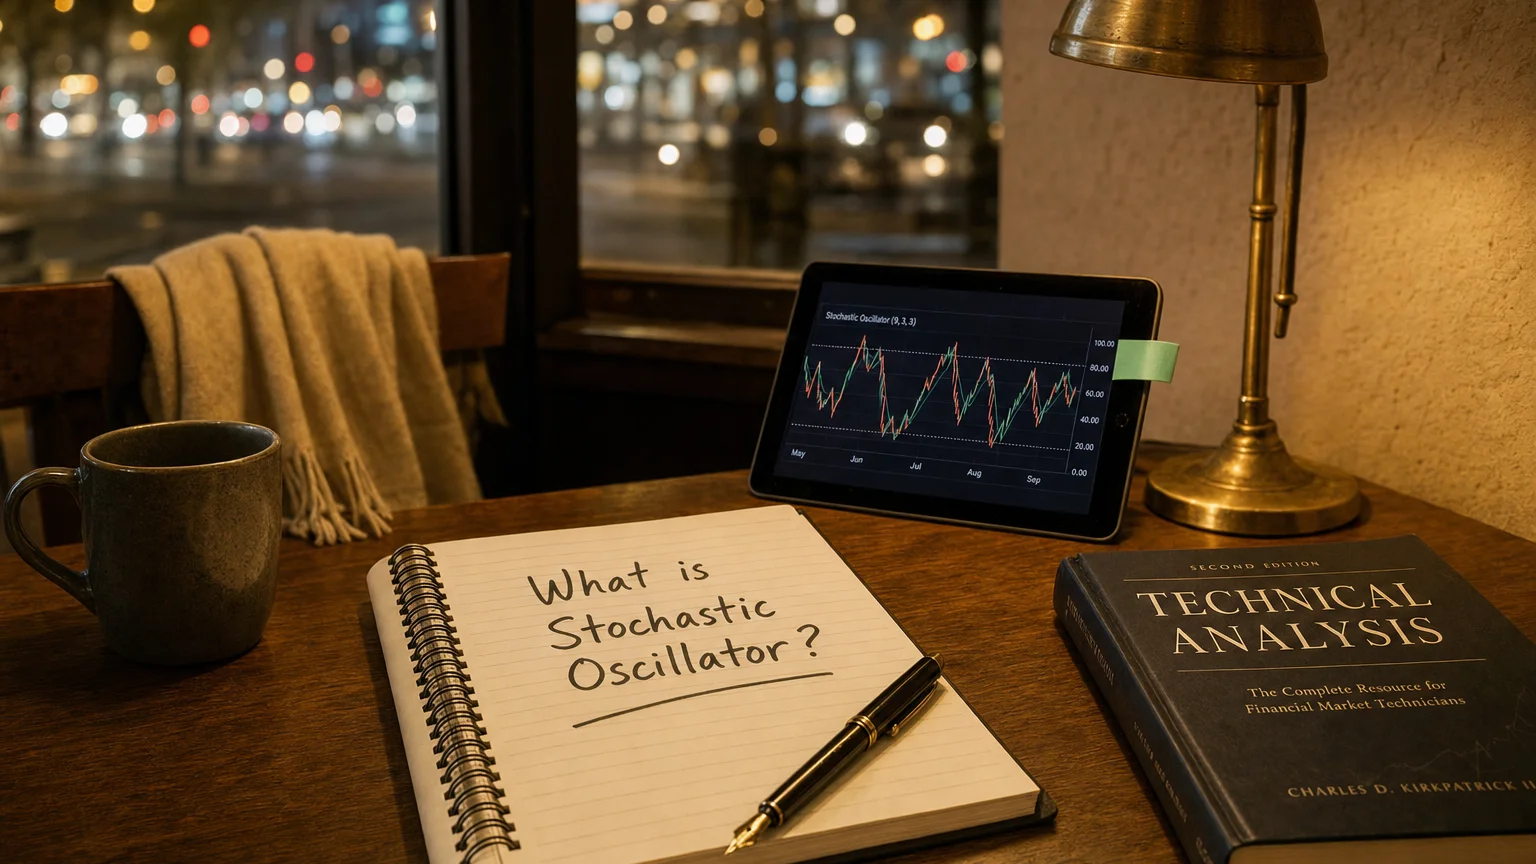
Invented by George Lane in the late 1950s, the Stochastic Oscillator is one of the oldest and most battle-tested momentum indicators. It compares the current closing price to the price range over the last N periods, answering a simple question: ‘Is price closing near the top (strong) or bottom (weak) of its recent range?’ The result is a bouncy 0–100 oscillator that shines at spotting overbought/oversold conditions, divergences, and potential reversals – especially in ranging markets. Even in trends, it helps time pullbacks like a pro. Fast, intuitive, and still crushing it decades later.
How It’s Calculated – The Two-Line Dance
Classic ‘Slow’ Stochastic (most common):
- %K: (Current Close − Lowest Low in N) / (Highest High in N − Lowest Low in N) × 100.
- %D: Simple 3-period moving average of %K (the signal line).
- N usually 14 periods.
Fast Stochastic skips the %D smoothing – raw and twitchy. Slow adds it for calmer signals.
Full Stochastic lets you customize all three: look-back, %K smooth, %D smooth.
Reading the Oscillator – Classic Signals
“Technical analysis tracks the past; it does not predict the future. You have to use your own intelligence to draw conclusions.”
— Bruce Kovner, Hedge fund trader, founder of Caxton Associates Market Wizards: Interviews with Top Traders, Jack D. Schwager (New York Institute of Finance, 1989), chapter “Bruce Kovner — The World Trader” (1989)
Timeless interpretations:
- Above 80: Overbought – sellers may step in soon.
- Below 20: Oversold – buyers could emerge.
- %K crosses above %D: Bullish signal (especially below 20).
- %K crosses below %D: Bearish signal (especially above 80).
- Bullish divergence: Price lower low, Stochastic higher low → reversal potential.
- Bearish divergence: Price higher high, Stochastic lower high → upside fading.
In strong trends, Stochastic can stay pinned overbought/oversold – use with trend filters.
Parameter Tweaks – Finding Your Flavor
Common settings:
- Fast (14,3,1): Raw %K with light %D – aggressive signals, more noise.
- Standard (14,3,3): Classic slow – balanced for most charts.
- Smooth (21,5,5 or 28,7,7): Calmer lines – great on higher timeframes or volatile assets.
- Short (5–9): Scalping territory – quick but whipsaw-prone.
Longer periods = fewer signals, higher reliability; shorter = more action.
Battle-Tested Trading Setups
Proven plays:
- Oversold bounce: Stochastic <20 + %K crosses up %D → buy (confirm with price action).
- Overbought fade: >80 + %K crosses down %D → short or exit longs.
- Pullback in trend: Uptrend (price > 200-MA) + Stochastic dips to 20–40 → buy the bounce.
- Divergence hunter: Classic reversal setup – enter on divergence + crossover confirmation.
In strong trends, wait for Stochastic to exit extreme zones before counter-trend trades.
Smart Combinations
Pair it up for extra edge:
- Trend filter (MA/ADX): Only buy oversold in uptrends, sell overbought in downtrends.
- Volume: Signal + volume spike = higher conviction.
- Support/Resistance: Oversold at key support = stronger bounce odds.
- Bollinger Bands: Stochastic extreme + price at band = mean-reversion candidate.
Strengths and Classic Pitfalls
The Wins
- Excellent at timing entries in ranges and pullbacks in trends.
- Clear overbought/oversold zones and crossover signals.
- Works across all markets and timeframes.
- Divergences often spot reversals early.
The Gotchas
- Whipsaws in choppy ranges – multiple false crosses.
- Stays extreme in strong trends – can signal ‘overbought’ forever.
- Lags slightly – based on past range, not future moves.
Your Stochastic Setup Checklist
- Pick settings matching timeframe (14,3,3 classic starter).
- Add trend filter (MA or ADX) to avoid counter-trend traps.
- Require price action confirmation on signals.
- Backtest overbought/oversold thresholds per asset.
- Watch divergences – often the highest-probability setups.